WinChart Technical Analysis
Daily Market analysis
| We
are an approved Securities Industry Development Corporation (SIDC)-CPE Training Provider. the training and development arm of the Securities Commission Malaysia (SC). |
|||
 |
 |
||
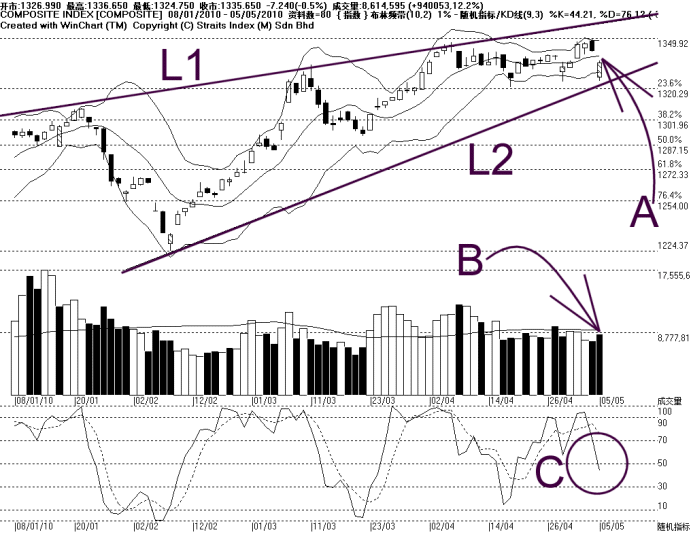
Meanwhile, the KLCI is fluctuating in between the L1 and L2 line, and if the KLCI should break below the L2 line, there is a risk of forming a downtrend.
As indicated by A, the KLCI breaks below the Bollinger Middle Band, thus the immediate technical outlook is still weak. Fortunately, the Bollinger Bands has not really expanded, thus the KLCI has not formed a downtrend yet.
As indicated by B, total market volume increased 12.2%, suggesting some increased of selling pressure. But still, despite the KLCI falling over 16 points in intra-day trading, the increased of volume was not significant, thus suggesting that the selling was not too extreme.
As circled at C, the Stochastic breaks below 50%, suggesting that the short term movement of the KLCI is turning weaker, but it has not entered into the short term bearish territory. If the Stochastic should break below 30% level, it would be a short term bearish signal for the KLCI.
In conclusion, as the global markets are moving lower, the KLCI is likely to stay weak for the immediate term. Technically, if the Bollinger Bands should continue to expand, with the KLCI below the Bollinger Middle Band, more down side movement is expected for the KLCI.
Find this analysis useful? Why not share it with others? Click Here to send this to a friend
 1st Online Training In Malaysia |
 |
 |
 |
| View the Online Training | More Market Analysis | Find out more about WinChart | Upcoming Events |
Straits Index (M)
Sdn Bhd
No. 16, Jalan LP 1A / 5, Lestari Perdana,
43300 Seri Kembangan, Selangor
Hotline: (03) 8941 6828 (5
lines) Fax: (03) 8941 9828
Email: info@straitsindex.com
© Copyright 1997-2010 Straits Index (M) Sdn Bhd All
rights reserved