WinChart Technical Analysis
Daily Market analysis
| We
are an approved Securities Industry Development Corporation (SIDC)-CPE Training Provider. the training and development arm of the Securities Commission Malaysia (SC). |
|||
 |
 |
||
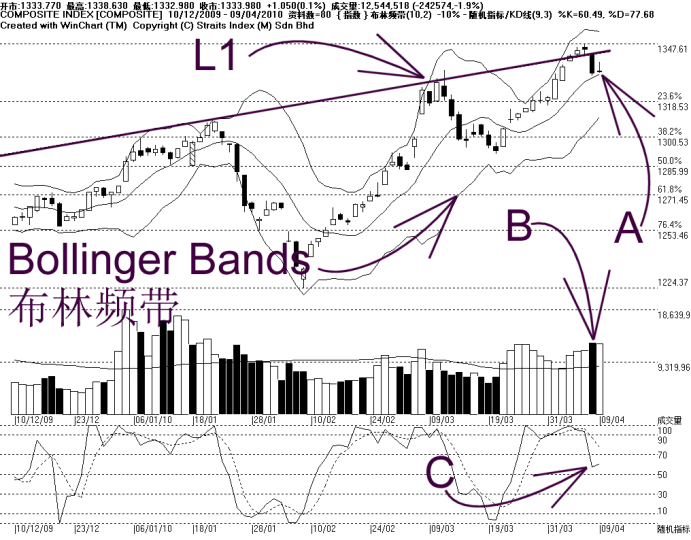
As indicated by A, the KLCI tested the Bollinger Middle Band on Friday and rebounded slightly, and now resisted by the 1335 WinChart Automatic Fibonacci Retracement, to close at 1333.98 points. The Bollinger Middle Band is still the dynamic support for the KLCI while the immediate resistance is at 1334. Support remains at 1308 WinChart Automatic Fibonacci Retracement.
As shown on the chart above, the Bollinger Bands contracted 10%, suggesting that the consolidation remains intact, and the consolidation of the KLCI is expected to carry on until the re-expansion of the Bollinger Bands.
As indicated by B, total market volume declined 1.9%, while still staying firmly above the 40-day VMA level. This suggests that the overall market is still well-participated, and generally, with volume above the 40-day VMA level, the market sentiment is likely to remain positive.
As indicated by C, the Stochastic rebounded, but it has not broken above 70% level, and this implies some improvement of the short term movement of the KLCI.
In conclusion, the KLCI managed to rebound from the Bollinger Middle Band, which is the dynamic support, and this is an important factor suggesting that the immediate technical outlook is still on the positive side, and there is still a chance for the KLCI to resume its uptrend. Meanwhile, with the Stochastic still below 70% level, this suggests that the KLCI short term movement has not returned its bullishness.
Find this analysis useful? Why not share it with others? Click Here to send this to a friend
 1st Online Training In Malaysia |
 |
 |
 |
| View the Online Training | More Market Analysis | Find out more about WinChart | Upcoming Events |
Straits Index (M)
Sdn Bhd
No. 16, Jalan LP 1A / 5, Lestari Perdana,
43300 Seri Kembangan, Selangor
Hotline: (03) 8941 6828 (5
lines) Fax: (03) 8941 9828
Email: info@straitsindex.com
© Copyright 1997-2010 Straits Index (M) Sdn Bhd All
rights reserved