WinChart Technical Analysis
Daily Market analysis
| We
are an approved Securities Industry Development Corporation (SIDC)-CPE Training Provider. the training and development arm of the Securities Commission Malaysia (SC). |
|||
 |
 |
||
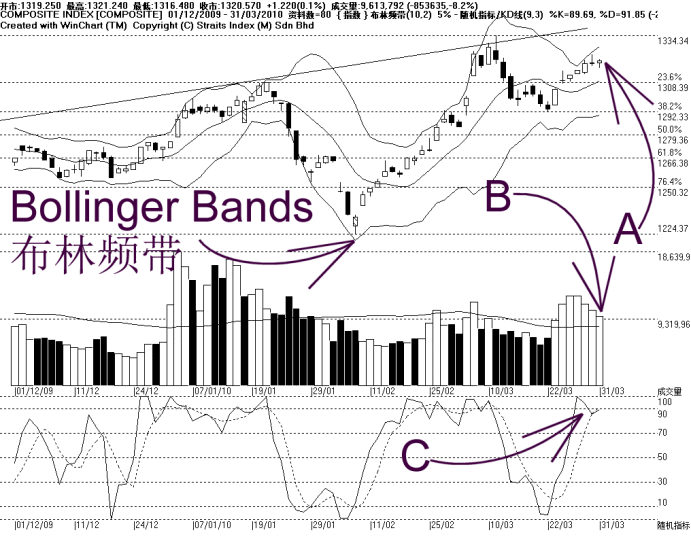
As indicated by A, the FBM KLCI moved sideways, gaining only 1.22 points to close at 1320.57 points. Support for the KLCI remains at 1308 WinChart Automatic Fibonacci Retracement while the resistance is still at 1334.34 WinChart Automatic Fibonacci Retracement.
As shown on the chart above, the Bollinger Bands expanded only 5%, suggesting that the upside movement of the KLCI is not significant, or the KLCI could be consolidating again. If the KLCI should consolidate, the Bollinger Middle Band would be the first target, as the Bollinger Middle Band is serving as the dynamic support.
As indicated by B, total market volume decreased 8.2%, but the volume remains above the 40-day VMA level, suggesting that the overall market participation is still at a healthy level.
As indicated by C, the Stochastic %K line is now below the %D line, suggesting that the short term movement might be turning weaker. If the Stochastic should break below 70% level, it would be an end to the short term bullish signal.
In conclusion, the KLCI rally has slowed down due to profit taking, but still, the KLCI is still supported by the Bollinger Middle Band, thus the immediate technical outlook is on the positive side.
Find this analysis useful? Why not share it with others? Click Here to send this to a friend
 1st Online Training In Malaysia |
 |
 |
 |
| View the Online Training | More Market Analysis | Find out more about WinChart | Upcoming Events |
Straits Index (M)
Sdn Bhd
No. 16, Jalan LP 1A / 5, Lestari Perdana,
43300 Seri Kembangan, Selangor
Hotline: (03) 8941 6828 (5
lines) Fax: (03) 8941 9828
Email: info@straitsindex.com
© Copyright 1997-2010 Straits Index (M) Sdn Bhd All
rights reserved