WinChart Technical Analysis
Daily Market analysis
| We
are an approved Securities Industry Development Corporation (SIDC)-CPE Training Provider. the training and development arm of the Securities Commission Malaysia (SC). |
|||
 |
 |
||
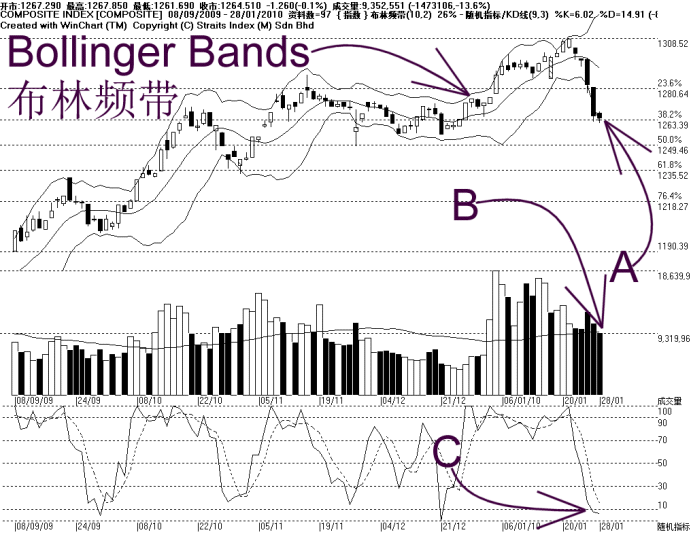
On Thursday, the KLCI only loss a marginally 1.26 points after falling heavily for two days. The KLCI closed at 1264.51 points, with its support at 1250 WinChart Automatic Fibonacci Retracement while the resistance is at 1272 WinChart Automatic Fibonacci Retracement.
As shown on the chart above, the Bollinger Bands expansion rate has reduced from the previously 65% to only 26%, this suggests that the volatility of the KLCI has reduced, but the immediate bearish outlook remains intact. If the Bollinger Bands should begin to contract, it would be a signal suggesting a consolidation for the KLCI, with the Bollinger Middle Band being the first target.
As indicated by B, total market volume declined 13.6%, with volume falling to the 40-day VMA level. It seems like the overall market participation has reduced, and if the volume should fall below the 40-day VMA level, it means that the market is getting quiet again, thus the KLCI is likely to consolidate with weakness.
As indicated by C, the Stochastic is still below 10% level, this suggests that the short term movement of the KLCI is still weak with some over-sold condition. Therefore, the KLCI is due for a technical rebound in the near term..
In short, the technical picture of the KLCI is still weak, at least for the short term, but with the KLCI is likely to consolidate as the Bollinger Bands is showing a possible consolidation signal. But still, provided that the KLCI is still resisted by the Bollinger Middle Band, while the Stochastic is still below 30% level, the short term movement for the KLCI is expected to be weak.
Find this analysis useful? Why not share it with others? Click Here to send this to a friend
 1st Online Training In Malaysia |
 |
 |
 |
| View the Online Training | More Market Analysis | Find out more about WinChart | Upcoming Events |
Straits Index (M)
Sdn Bhd
No. 16, Jalan LP 1A / 5, Lestari Perdana,
43300 Seri Kembangan, Selangor
Hotline: (03) 8941 6828 (5
lines) Fax: (03) 8941 9828
Email: info@straitsindex.com
© Copyright 1997-2010 Straits Index (M) Sdn Bhd All
rights reserved