WinChart Technical Analysis
Daily Market analysis
| We
are an approved Securities Industry Development Corporation (SIDC)-CPE Training Provider. the training and development arm of the Securities Commission Malaysia (SC). |
|||
 |
 |
||
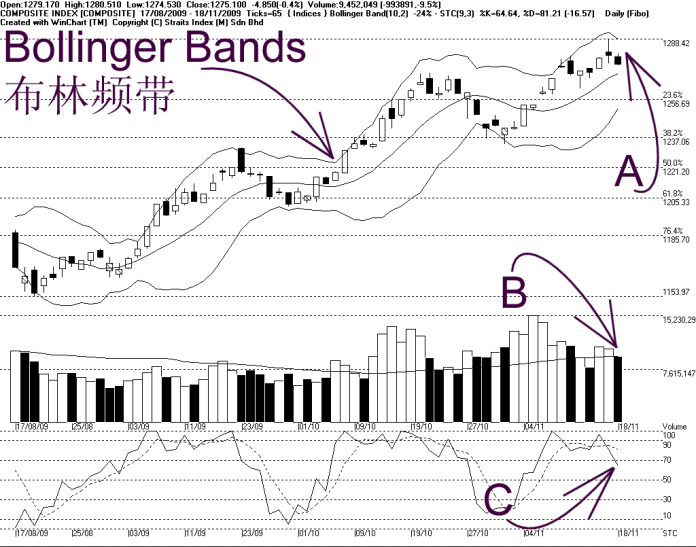
As indicated by A, the FBM KLCI ended 4.85 points lower to close at 1275.10 points. Meanwhile, the Bollinger Bands contracted 24%, suggesting that the KLCI is indeed consolidating again, and the Bollinger Middle Band shall be the target of the consolidation or technical correction. If the KLCI should rebound from the Bollinger Middle Band, there is a chance that the KLCI might resume its uptrend.
In other words, if the KLCI should break below the Bollinger Middle Band, there is a risk of the KLCI forming a downtrend. Support for the KLCI is at 1270 WinChart Automatic Fibonacci Retracement while the resistance is still at 1300 psychological level.
As indicated by B, total market volume declined 9.5%, with volume now touching the 40-day VMA level. If volume should break below the 40-day VMA level, it suggests the market activities is relatively quiet, as investors are staying on the sidelines.
As indicated by C, the Stochastic breaks below 70% level, ended the short term bullish movement. If the Stochastic should remain below 70% level, the consolidation of the KLCI is expected to continue, and if the Stochastic should break below 30% level, it would be a short term bearish signal for the KLCI.
In short, the KLCI is still consolidating, and if the KLCI should be supported by the Bollinger Middle Band, the immediate outlook for the KLCI is still positive, and there is still a chance for the KLCI to resume its uptrend. However, if the KLCI should break below the Bollinger Middle Band, the weakening movement of the KLCI is expected to carry on.
Find this analysis useful? Why not share it with others? Click Here to send this to a friend
 1st Online Training In Malaysia |
 |
 |
 |
| View the Online Training | More Market Analysis | Find out more about WinChart | Upcoming Events |
Straits Index (M)
Sdn Bhd
No. 16, Jalan LP 1A / 5, Lestari Perdana,
43300 Seri Kembangan, Selangor
Hotline: (03) 8941 6828 (5
lines) Fax: (03) 8941 9828
Email: info@straitsindex.com
© Copyright 1997-2009 Straits Index (M) Sdn Bhd All
rights reserved