WinChart Technical Analysis
Daily Market analysis
| We
are an approved Securities Industry Development Corporation (SIDC)-CPE Training Provider. the training and development arm of the Securities Commission Malaysia (SC). |
|||
 |
 |
||
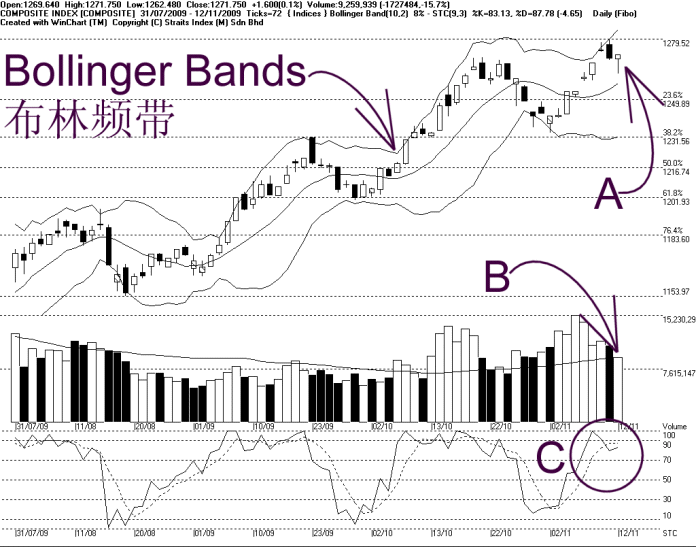
Initially, the FBM KLCI was lower as pulled down by the negative performance in markets abroad. Despite having an intra-day lower touching 1262.48 points, the KLCI managed to close above the 1270 WinChart Automatic Fibonacci Retracement, this suggests that the 1270 WinChart Automatic Fibonacci Retracement is still the support for the KLCI, while the resistance is at 1300 psychological level.
As indicated by A, the KLCI formed a Hammer candlestick. This implies that despite the intra-day weaker movement, the KLCI managed to rebound, and even ended with some gain as the buying interest remains strong. Therefore, there is still a chance of the KLCI to resume its uptrend.
Generally, provided that the KLCI is still supported by the Bollinger Middle Band, the immediate outlook is still positive. And any retreat above the Bollinger Middle Band, is considered as a technical correction. If the KLCI should break below the Bollinger Middle Band, there is a risk of a trend reversal.
As indicated by B, total market volume declined 15.7%, with volume still above the 40-day VMA level. Therefore, the market is still well-participated and the overall market sentiment is still on the positive side.
As circled at C, the Stochastic rebounded, and remains above 70% level, this shows that the market movement for the short term is still bullish biased, until the Stochastic should break below 70% level.
Find this analysis useful? Why not share it with others? Click Here to send this to a friend
 1st Online Training In Malaysia |
 |
 |
 |
| View the Online Training | More Market Analysis | Find out more about WinChart | Upcoming Events |
Straits Index (M)
Sdn Bhd
No. 16, Jalan LP 1A / 5, Lestari Perdana,
43300 Seri Kembangan, Selangor
Hotline: (03) 8941 6828 (5
lines) Fax: (03) 8941 9828
Email: info@straitsindex.com
© Copyright 1997-2009 Straits Index (M) Sdn Bhd All
rights reserved