WinChart Technical Analysis
Daily Market analysis
| We
are an approved Securities Industry Development Corporation (SIDC)-CPE Training Provider. the training and development arm of the Securities Commission Malaysia (SC). |
|||
 |
 |
||
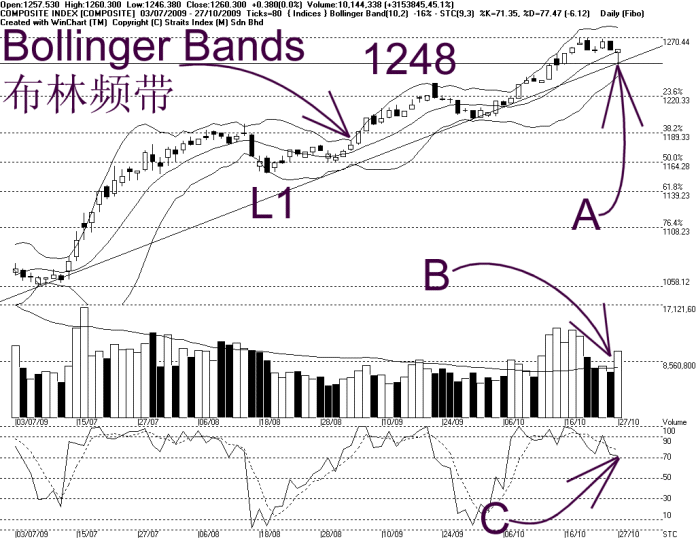
As the over night loss of the Dow Jones Industrial Average, most major indices in Asian were lower, including the FBM KLCI. The KLCI had its intraday losing of 13.54 points, but as indicated by A, the KLCI rebounded precisely at 2348 WinChart Automatic Fibonacci Retracement, which suggests that the 1248 WinChart Automatic Fibonacci Retracement is still an important support for the KLCI. Nevertheless, if the KLCI should beak below the 1248 WinChart Automatic Fibonacci Retracement, then the next support for the KLCI is at 1220 WinChart Automatic Fibonacci Retracement.
As shown on the chart above, the Bollinger Bands contracted 16%, suggesting that the KLCI is still consolidating. As lead by the regional markets, the KLCI breaks below the Bollinger Middle Band, while still consolidating, but managed to close above at the Bollinger Middle Band . Nevertheless, with the KLCI still above the Bollinger Middle Band, the uptrend is still intact.
As indicated by B, total market volume increased, breaking above the 40-day VMA level, despite that the KLCI ended lower. This suggests that the market participation as a whole is still active, and provided that the volume could maintain above the 40-day VMA level, the bullish biased sentiment is likely to be sustainable. Meanwhile, the lower shadow candlestick of the KLCI suggested some bargain hunting activities.
With the Stochastic still above the 70% level, this suggests that the short term movement of the KLCI is still bullish biased. Provided that the Stochastic could hold up to above 70% level, the short term uptrend for the KLCI is expected to continue.
Due to external factors, the KLCI had its intra-day low touching the 1248 WinChart Automatic Fibonacci Retracement. Since the 1248 WinChart Automatic Fibonacci Retracement overlaps with the L1 uptrend line, it is generally a stronger support for the KLCI. In short, the KLCI is still in an uptrend, unless the KLCI should break below the Bollinger Middle Band or the 1248 WinChart Automatic Fibonacci Retracement or the L1 uptrend line.
Find this analysis useful? Why not share it with others? Click Here to send this to a friend
 1st Online Training In Malaysia |
 |
 |
 |
| View the Online Training | More Market Analysis | Find out more about WinChart | Upcoming Events |
Straits Index (M)
Sdn Bhd
No. 16, Jalan LP 1A / 5, Lestari Perdana,
43300 Seri Kembangan, Selangor
Hotline: (03) 8941 6828 (5
lines) Fax: (03) 8941 9828
Email: info@straitsindex.com
© Copyright 1997-2009 Straits Index (M) Sdn Bhd All
rights reserved