WinChart Technical Analysis
Daily Market analysis
| We
are an approved Securities Industry Development Corporation (SIDC)-CPE Training Provider. the training and development arm of the Securities Commission Malaysia (SC). |
|||
 |
 |
||
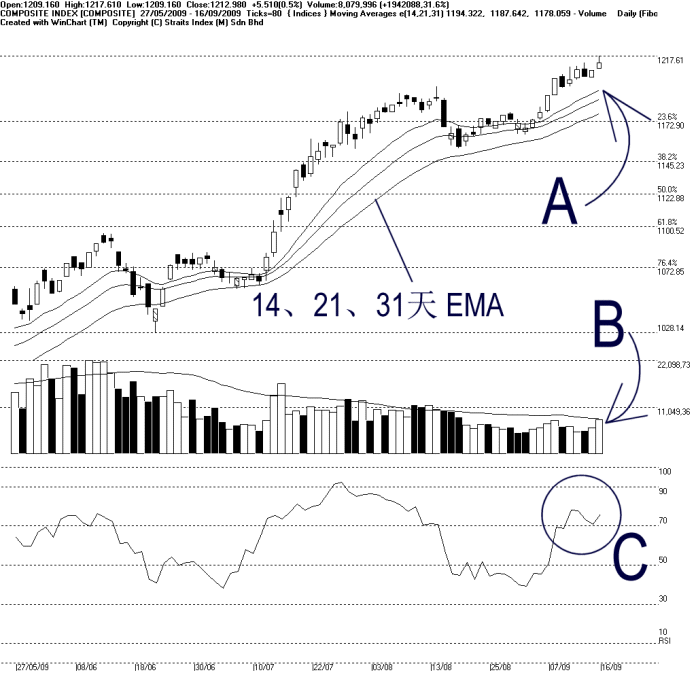
As indicated by A, the FBM KLCI gained 5.51 points or 0.5%, closing at 1212.98 points, a 20 months new high. Resistance for the KLCI remains at 1248 WinChart Automatic Fibonacci Retracement while the supports are at 1200 psychological level as well as 1169 WinChart Automatic Fibonacci Retracement.
Despite the slight contraction of the Bollinger Bands, the KLCI is still above the Bollinger Middle Band as well as the 14, 21, 31 EMA dynamic support. This suggests that the uptrend of the KLCI remains intact. However, with the Bollinger Bands Width contracting, the KLCI upside volatility is reduced.
As indicated by B, total market volume increased 31.6%, almost touching 40-day VMA level. The increased of volume suggests the increased of buying interest, as well as in flow of fresh capital. If volume should continue to increase and maintain above the 40-day VMA level, it would be a positive element to support for uptrend of the KLCI.
As circled at C, the WinChart RSI rebounded above 70% level in the mid term bullish territory. Therefore, as long as the WinChart RSI is still above 70% level, the market movement for the mid term is still bullish biased.
In short, the uptrend of the KLCI remains intact. With the increased of market volume, the uptrend is expected to continue. However, as the Bollinger Bands Width contracts, the upside movement of the KLCI is slightly reduced. Nevertheless, as long as the regional market sentiment remains unchanged, the outlook for the KLCI remains bullish biased.
Find this analysis useful? Why not share it with others? Click Here to send this to a friend
 1st Online Training In Malaysia |
 |
 |
 |
| View the Online Training | More Market Analysis | Find out more about WinChart | Upcoming Events |
Straits Index (M)
Sdn Bhd
No. 16, Jalan LP 1A / 5, Lestari Perdana,
43300 Seri Kembangan, Selangor
Hotline: (03) 8941 6828 (5
lines) Fax: (03) 8941 9828
Email: info@straitsindex.com
© Copyright 1997-2009 Straits Index (M) Sdn Bhd All
rights reserved