WinChart Technical Analysis
Daily Market analysis
| We
are an approved Securities Industry Development Corporation (SIDC)-CPE Training Provider. the training and development arm of the Securities Commission Malaysia (SC). |
|||
 |
 |
||
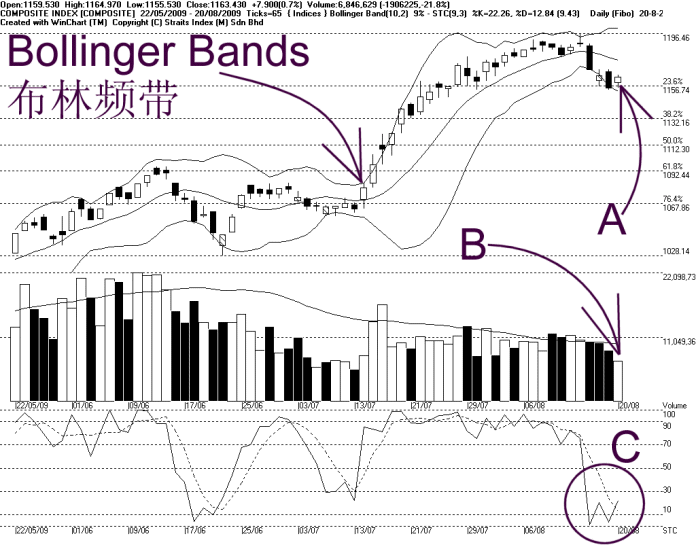
As indicated by A, the KLCI rebounded 7.90 pt today, to close at 1163.43 pt, returning to above the 1163 pt WinChart Automatic Fibonacci Retracement (WAFR), this means 1163 pt is back to become support level of the KLCI, while the immediate resistance is 1183 pt WAFR.
As shown in the chart, the Bollinger Bands expanded only 9% from the previous 41%, this means that the correction of the KLCI had slowed down, and should the Bollinger Bands begins to narrow, the downtrend of the KLCI would end, and the KLCI could consolidate. Normally the KLCI has to break above the Bollinger Middle Band, then only the KLCI will have a chance to pick up some strength.
As pointed by B, volume traded decreased 21.8% as investors are being cautious about the outlook of the KLCI, the reduced volume is a classic scenario during the KLCI correction state. Actually, if volume traded was too high during a correction state, it means that the selling pressure is too high, and it is usually harder for the KLCI to turn stronger in the short term.
As circled at C, the Stochastic rebounded as the short term movement of the KLCI was over-sold; however, the Stochastic still need to break above 30%, in order to confirm that the KLCI has recovered from the recent down trend; and if the Stochastic should break above 70%, the KLCI would be entering a short term up trend.
The KLCI had a technical rebound as the rate of the Bollinger Bands expansion has reduced; however, it is still inadequate to confirm the KLCI is breaking away from the downtrend, unless the KLCI is successfully returning to above the Bollinger Middle Band. On the other hand, if the Stochastic should break above 30%, this should mark the end of short term down trend, and therefore, the Stochastic is another suitable indicator to monitor.
Find this analysis useful? Why not share it with others? Click Here to send this to a friend
 1st Online Training In Malaysia |
 |
 |
 |
| View the Online Training | More Market Analysis | Find out more about WinChart | Upcoming Events |
Straits Index (M)
Sdn Bhd
No. 16, Jalan LP 1A / 5, Lestari Perdana,
43300 Seri Kembangan, Selangor
Hotline: (03) 8941 6828 (5
lines) Fax: (03) 8941 9828
Email: info@straitsindex.com
© Copyright 1997-2009 Straits Index (M) Sdn Bhd All
rights reserved