WinChart Technical Analysis
Daily Market analysis
| We
are an approved Securities Industry Development Corporation (SIDC)-CPE Training Provider. the training and development arm of the Securities Commission Malaysia (SC). |
|||
 |
 |
||
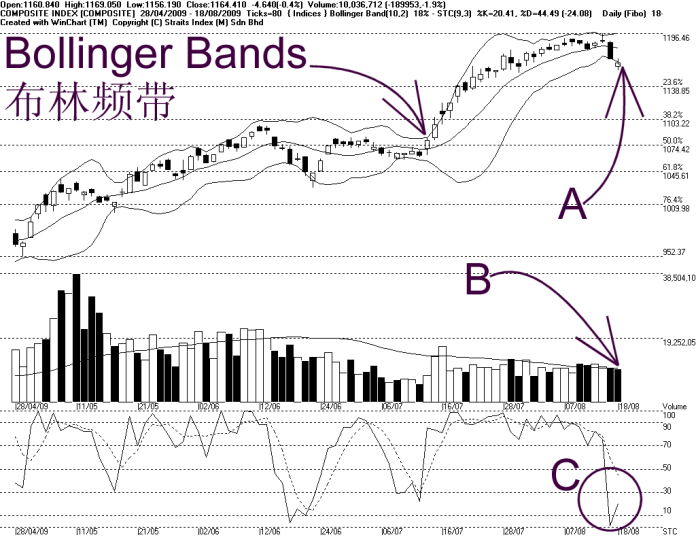
As indicated by A, the Bollinger Bands (BB) continues to expand 19%, therefore, the KLCI declined further, to close 4.64 pt lower at 1164.41 pt. The support level of the KLCI remains at 1163 pt WinChart Automatic Fibonacci Retracement (WAFR), while the resistance is at 1186 pt WAFR.
As shown in the chart above, the KLCI is already below the Bollinger Middle Band, and therefore, the expanding Bollinger Bands suggesting that the bearish biased movement of the KLCI continue; in other words, the KLCI has to break above the Bollinger Middle Band dynamic resistance, in order to stop declining, before reversing to up trend again.
As indicated by B, volume traded was 1.9% lower compared to previous day, it is just barely touching the level of 40 days Volume Moving Average (VMA). This is an early sign of investors turning away from the market, and this is usually normal when the KLCI is on a down trend.
As indicated by C, the Stochastic rebounded today after touching the zero level; therefore, the KLCI short term had a technical rebound, after being grossly oversold. Nonetheless, the Stochastic needs to break above the 30% mark, then only it has a chance to break away from the short term down trend.
Technically speaking, the KLCI is on a down trend, it means that the KLCI will continue to fall until Bollinger Bands should begin to contract. For the moment, if the KLCI could stay above 1163 pt or the 14, 21, 31 days Exponential Moving Average, the KLCI would consolidate or move in a sideways manner; otherwise, the KLCI outlook shall remain weak.
Find this analysis useful? Why not share it with others? Click Here to send this to a friend
 1st Online Training In Malaysia |
 |
 |
 |
| View the Online Training | More Market Analysis | Find out more about WinChart | Upcoming Events |
Straits Index (M)
Sdn Bhd
No. 16, Jalan LP 1A / 5, Lestari Perdana,
43300 Seri Kembangan, Selangor
Hotline: (03) 8941 6828 (5
lines) Fax: (03) 8941 9828
Email: info@straitsindex.com
© Copyright 1997-2009 Straits Index (M) Sdn Bhd All
rights reserved