WinChart Technical Analysis
Daily Market analysis
| We
are an approved Securities Industry Development Corporation (SIDC)-CPE Training Provider. the training and development arm of the Securities Commission Malaysia (SC). |
|||
 |
 |
||
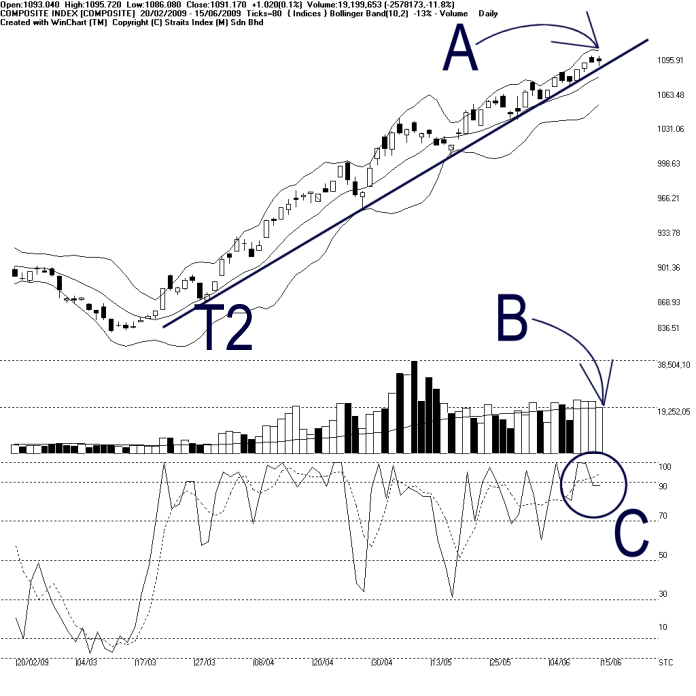
As indicated by A, the Bollinger Bands Width contracted another 13%, suggesting that the KLCI is consolidating. Provided that the Bollinger Bands Width is still contracting, the consolidation is expected to continue.
As shown on the chart above, resistance for the KLCI is still at 1100 level, while the Bollinger Middle Band and the T2 uptrend line are the dynamic supports. If the KLCI should break below the T2 uptrend line, it would suggests an end to the uptrend which started since March, 2009.
As indicated by B, total market volume declined 11.8%, with volume barely above the 40-day VMA level. This shows that the overall market participation is declining. If volume is relatively lower, it means that the inflow of fresh capital is insufficient to over come the selling pressure, thus the KLCI is less likely to maintain its uptrend, not to mention a chance of a break out above 1100.
As circled at C, the Stochastic falls marginally on Monday, but still above 70% level. This means that the KLCI has not turned bearish yet, but a tendency of a technical correction. Nevertheless, if the Stochastic should break below 70%, more downside risk for the KLCI is expected.
For the first time in 2009, losers counters on Monday reached 607, also, many active counters are having profit taking; this has increased the risk of a technical correction for the KLCI. Nevertheless, if the KLCI should break below the T2 uptrend line, KLCI movement is expected to stay weak.
Find this analysis useful? Why not share it with others? Click Here to send this to a friend
 1st Online Training In Malaysia |
 |
 |
 |
| View the Online Training | More Market Analysis | Find out more about WinChart | Upcoming Events |
Straits Index (M)
Sdn Bhd
No. 16, Jalan LP 1A / 5, Lestari Perdana,
43300 Seri Kembangan, Selangor
Hotline: (03) 8941 6828 (5
lines) Fax: (03) 8941 9828
Email: info@straitsindex.com
© Copyright 1997-2009 Straits Index (M) Sdn Bhd All
rights reserved