WinChart Technical Analysis
Daily Market analysis
| We
are an approved Securities Industry Development Corporation (SIDC)-CPE Training Provider. the training and development arm of the Securities Commission Malaysia (SC). |
|||
 |
 |
||
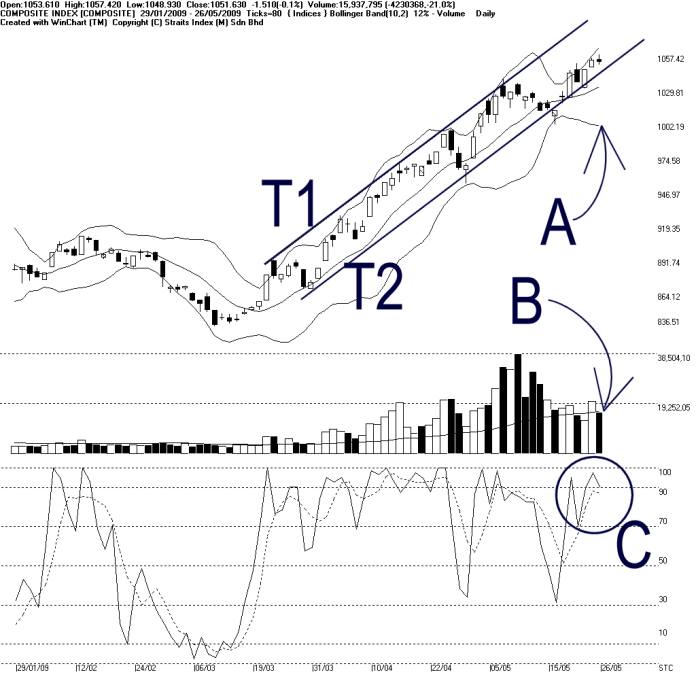
Despite having an intra-day high reaching 1057.42 points, the KLCI closed 1.51 lower at 1051.63 points. Therefore, the 1053 WinChart Automatic Fibonacci Retracement is still the resistance for the KLCI while the T2 line and Bollinger Middle Band are still the dynamic supports for the KLCI.
As indicated by A, the Bollinger Bands Width expanded only 12%, from the previous 24%, suggesting that the Bollinger Bands Width might be contracting. If the Bollinger Bands Width should contract, it would be a signal suggesting a technical correction or a consolidation for the KLCI, and usually the first target of the consolidation would be the Bollinger Middle Band.
As indicated by B, total market volume declined 21%, while barely above the 40-day VMA level. This shows that the market volume is not substantial to help the KLCI in breaking above the 1053 resistance. If volume should remain lower, the KLCI is likely to move sideways with some downside biased.
As circled at C, the Stochastic started falling after breaking above 90% level, which implies that the technical correction is likely to take place. However, the Stochastic has to break below 70% level to signal a beginning of a technical correction.
Due to lower market volume, the KLCI failed to break above the 1053, suggesting that the inflow of fresh buying interest is not enough to withstand the selling pressure at the 1053 resistance. Therefore, if the Bollinger Bands Width should begin to contract, the KLCI would consolidate again.
Find this analysis useful? Why not share it with others? Click Here to send this to a friend
 1st Online Training In Malaysia |
 |
 |
 |
| View the Online Training | More Market Analysis | Find out more about WinChart | Upcoming Events |
Straits Index (M)
Sdn Bhd
No. 16, Jalan LP 1A / 5, Lestari Perdana,
43300 Seri Kembangan, Selangor
Hotline: (03) 8941 6828 (5
lines) Fax: (03) 8941 9828
Email: info@straitsindex.com
© Copyright 1997-2009 Straits Index (M) Sdn Bhd All
rights reserved