WinChart Technical Analysis
Daily Market analysis
| We
are an approved Securities Industry Development Corporation (SIDC)-CPE Training Provider. the training and development arm of the Securities Commission Malaysia (SC). |
|||
 |
 |
||
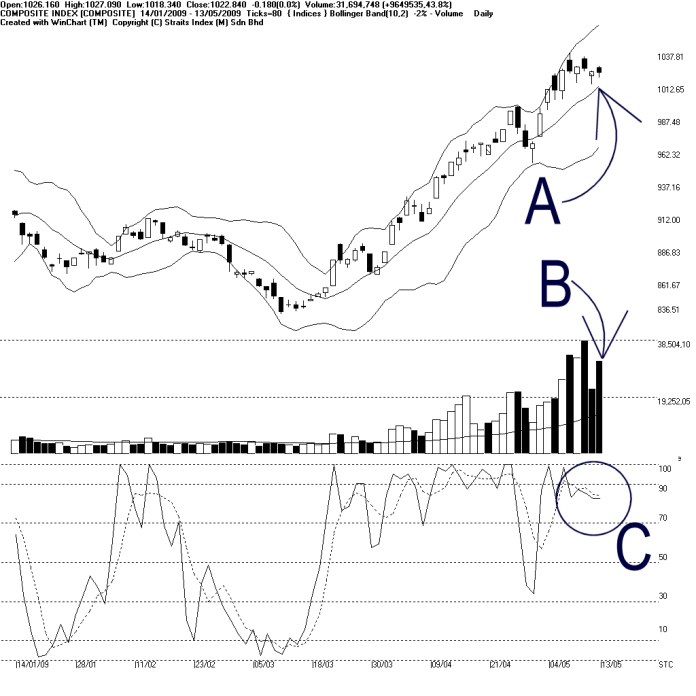
As shown on the chart above, the Bollinger Bands Width started to contract 2%, suggesting the KLCI is still consolidating. As a result, the KLCI ended almost flat, closing 0.18 points lower. As indicated by A, the KLCI is still above the Bollinger Middle Band, which is serving as the dynamic support. If the KLCI should rebound above the Bollinger Middle Band, it would resume its uptrend.
Nonetheless, other supports for the KLCI are at 200-day MA as well as the 1000 level, while the resistance is still at 1053 WinChart Automatic Fibonacci Retracement.
As indicated by B, total market volume increased 43.8%, with volume further above the 40-day VMA level. Once again, this shows that the market is indeed very well-participated, and as long as the volume is still above the 40-day VMA level, the market positive biased sentiment is expected to continue.
As circled at C, the Stochastic is still above 70% level, despite the consolidation of the KLCI. Therefore, the short term bullish market movement is still intact. If the Stochastic should break below 70% level, the short term movement of the KLCI might turn weak.
As of today, the KLCI has been moving sideways for 5 consecutive days, while still supported by the Bollinger Middle Band. This shows that the current consolidation is still healthy. If the KLCI should rebound above the Bollinger Middle Band, it would be a signal suggesting a resume of its uptrend, and the expansion of the Bollinger Bands Width would confirm the bullish movement signal.
Find this analysis useful? Why not share it with others? Click Here to send this to a friend
 1st Online Training In Malaysia |
 |
 |
 |
| View the Online Training | More Market Analysis | Find out more about WinChart | Upcoming Events |
Straits Index (M)
Sdn Bhd
No. 16, Jalan LP 1A / 5, Lestari Perdana,
43300 Seri Kembangan, Selangor
Hotline: (03) 8941 6828 (5
lines) Fax: (03) 8941 9828
Email: info@straitsindex.com
© Copyright 1997-2009 Straits Index (M) Sdn Bhd All
rights reserved