WinChart Technical Analysis
Daily Market analysis
| We
are an approved Securities Industry Development Corporation (SIDC)-CPE Training Provider. the training and development arm of the Securities Commission Malaysia (SC). |
|||
 |
 |
||
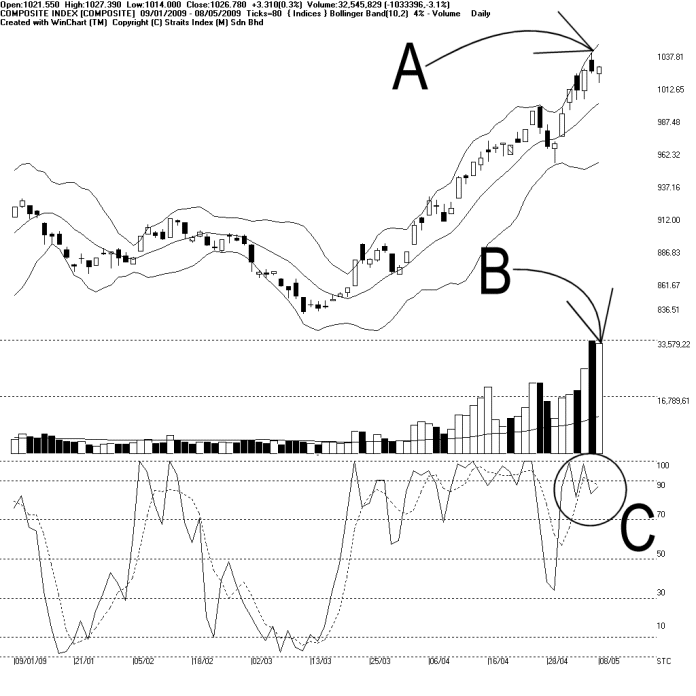
As indicated by A, the Bollinger Bands Width opened only 4%, compared to the 8% previously. This suggests that the KLCI is likely to consolidate, and as a result, the KLCI up only 3.31 points or 0.3% on Friday. Resistance for the KLCI is still at 1053 WinChart Automatic Fibonacci Retracement while the supports are at 200-day MA as well as the Bollinger Middle Band dynamic support.
As indicated by B, total market volume declined 3.1%, but still further above the 40-day VMA level. This shows that the market is still very actively participated, which is a positive note to the market sentiment in general. Nevertheless, if the KLCI should consolidate, volume is expected to decline further as investors would usually stay on the sidelines.
As circled at C, although the Stochastic started falling after hitting 100%, it is still above 70% level, which suggests that the short term bullish signal is still intact. As long as the Stochastic is still above 70% level, the market strength for the short term is still bullish biased.
The KLCI moved sideways on Friday, which is the best scenario of a technical correction or a consolidation from the technical analysis stand point. If the KLCI should rebound from the Bollinger Middle Band after its consolidation, it would be a signal suggesting a continuation of the uptrend, and the confirmation to that would be the re-expansion of the Bollinger Bands Width.
Find this analysis useful? Why not share it with others? Click Here to send this to a friend
 1st Online Training In Malaysia |
 |
 |
 |
| View the Online Training | More Market Analysis | Find out more about WinChart | Upcoming Events |
Straits Index (M)
Sdn Bhd
No. 16, Jalan LP 1A / 5, Lestari Perdana,
43300 Seri Kembangan, Selangor
Hotline: (03) 8941 6828 (5
lines) Fax: (03) 8941 9828
Email: info@straitsindex.com
© Copyright 1997-2009 Straits Index (M) Sdn Bhd All
rights reserved