WinChart Technical Analysis
Daily Market analysis
| Learn Technical Analysis and get your credit hours at the same time. WinChart Technical Analysis Training is Accredited by: | |||
 |
 |
||
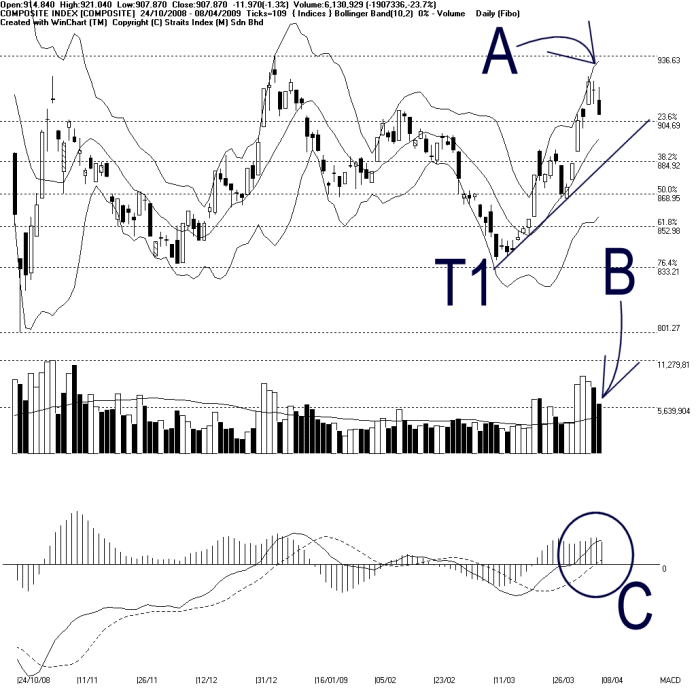
As indicated by A, the Bollinger Bands Width did not expanded (0%), suggesting it is likely to contract from now, thus a signal suggesting a consolidation or technical correction for the KLCI. Nevertheless, the first target of the technical correction is still the Bollinger Middle Band dynamic support.
As shown on the chart above, the 905 WinChart Automatic Fibonacci Retracement is still the important support level for the KLCI while the resistance is at 937 WinChart Automatic Fibonacci Retracement.
As indicated by B, total market volume declined 23.7%, but volume is still above the 40-day VMA level. This shows that despite the decline of volume, the market is still actively participated, which is still a good sign for the KLCI.
As circled at C, the MACD histogram started falling, and might be forming a rounding top. If the MACD histogram should form a rounding top, it would be a signal suggesting a short term technical correction for the KLCI. Provided that the MACD histogram is still falling, the short term movement of the KLCI is likely to be weak until the MACD histogram should tick up and form a rounding bottom.
Find this analysis useful? Why not share it with others? Click Here to send this to a friend
 1st Online Training In Malaysia |
 |
 |
 |
| View the Online Training | More Market Analysis | Find out more about WinChart | Upcoming Events |
Straits Index (M)
Sdn Bhd
No. 16, Jalan LP 1A / 5, Lestari Perdana,
43300 Seri Kembangan, Selangor
Hotline: (03) 8941 6828 (5
lines) Fax: (03) 8941 9828
Email: info@straitsindex.com
© Copyright 1997-2009 Straits Index (M) Sdn Bhd All
rights reserved