WinChart Technical Analysis
Daily Market analysis
| Learn Technical Analysis and get your credit hours at the same time. WinChart Technical Analysis Training is Accredited by: | |||
 |
 |
||
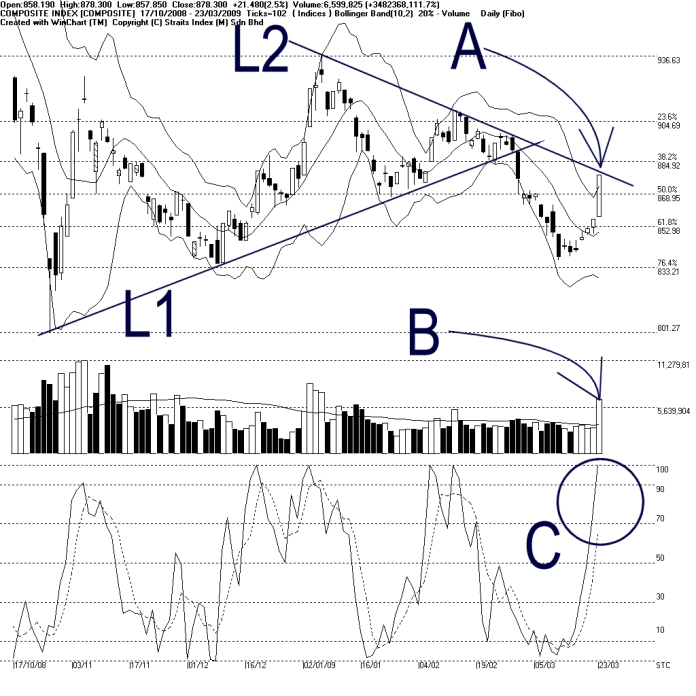
As indicated by A, the KLCI breaks above the 869 WinChart Automatic Fibonacci Retracement line and testing the L2 descending line of the Symmetrical Triangle, closing 21.48 points higher to 878.30 points. Next resistance for the KLCI is at 885 WinChart Automatic Fibonacci Retracement while the supports are at the 869 WinChart Automatic Fibonacci Retracement and the Bollinger Middle Band dynamic support.
As shown on the chart above, the Bollinger Bands Width expanded 20%, with the KLCI above the 40-day VMA level. This shows that the market participation has increased significantly as it seems like investors are regaining their confident. Therefore, as long as the market volume should remain above the 40-day VMA level, the KLCI movement is likely to be positive.
As circled at C, the Stochastic touched 100% on Monday, suggesting that the short term movement of the KLCI is indeed bullish. However, this also suggests that the KLCI is getting over-bought. If the Stochastic should break below 90% level, it would be a signal suggesting a possible technical correction. Nevertheless, as long as the Stochastic is still above 70%, the short term movement for the KLCI is still bullish biased.
With the bullish Bollinger Bands Width signals coupled with significant increased of volume, the immediate outlook for the KLCI is bullish biased. If the KLCI should have a technical correction, the Bollinger Middle Band would be the first target. However, if the KLCI should rebound from the Bollinger Middle Band again, it would be a signal suggesting a continuation of the rally.
Find this analysis useful? Why not share it with others? Click Here to send this to a friend
 1st Online Training In Malaysia |
 |
 |
 |
| View the Online Training | More Market Analysis | Find out more about WinChart | Upcoming Events |
Straits Index (M)
Sdn Bhd
No. 16, Jalan LP 1A / 5, Lestari Perdana,
43300 Seri Kembangan, Selangor
Hotline: (03) 8941 6828 (5
lines) Fax: (03) 8941 9828
Email: info@straitsindex.com
© Copyright 1997-2009 Straits Index (M) Sdn Bhd All
rights reserved