WinChart Technical Analysis
Daily Market analysis
| Learn Technical Analysis and get your credit hours at the same time. WinChart Technical Analysis Training is Accredited by: | |||
 |
 |
||
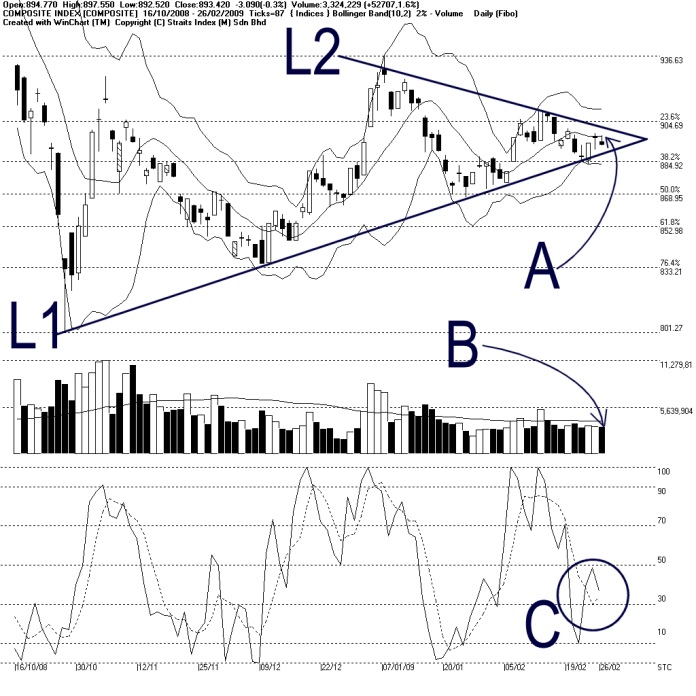
As indicated by A, the KLCI tested the Bollinger Middle Band again on Thursday, but remained resisted by the Bollinger Middle Band. This shows that other than the 905 WinChart Automatic Fibonacci Retracement, the Bollinger Middle Band is also another resistance for the KLCI. Support for the KLCI is still at 885 WinChart Automatic Fibonacci Retracement.
As shown on the chart above, the Bollinger Bands Width expanded only 2%, which is insignificant, and therefore, the KLCI is likely to remain in its consolidation. Furthermore, the KLCI is still trading within the symmetrical triangle, and therefore, the consolidation remains intact.
As indicated by B, total market volume increased 1.6%, but still below the 40-day VMA level. This shows that the market activities is still low as investors are still being cautious while waiting on the sidelines. Nevertheless, a lower volume during a consolidation stage is normal.
As circled at C, the Stochastic failed to break above 50% level, which suggests that the KLCI short term movement still has not regain its strength. If the Stochastic should break below 30% level again, it would be another short term bearish signal for the KLCI.
Since the KLCI is moving closer to the tip of the Symmetrical Triangle, the fluctuation is expected to be low. Nevertheless, if the KLCI should break above the L2 line, it would be a signal suggesting the KLCI might be gaining strength. If the KLCI should break below the L1 line, it would be a signal suggesting a weakening trend for the KLCI.
Find this analysis useful? Why not share it with others? Click Here to send this to a friend
 1st Online Training In Malaysia |
 |
 |
 |
| View the Online Training | More Market Analysis | Find out more about WinChart | Upcoming Events |
Straits Index (M)
Sdn Bhd
No. 16, Jalan LP 1A / 5, Lestari Perdana,
43300 Seri Kembangan, Selangor
Hotline: (03) 8941 6828 (5
lines) Fax: (03) 8941 9828
Email: info@straitsindex.com
© Copyright 1997-2009 Straits Index (M) Sdn Bhd All
rights reserved