WinChart Technical Analysis
Daily Market analysis
| Learn Technical Analysis and get your credit hours at the same time. WinChart Technical Analysis Training is Accredited by: | |||
 |
 |
||
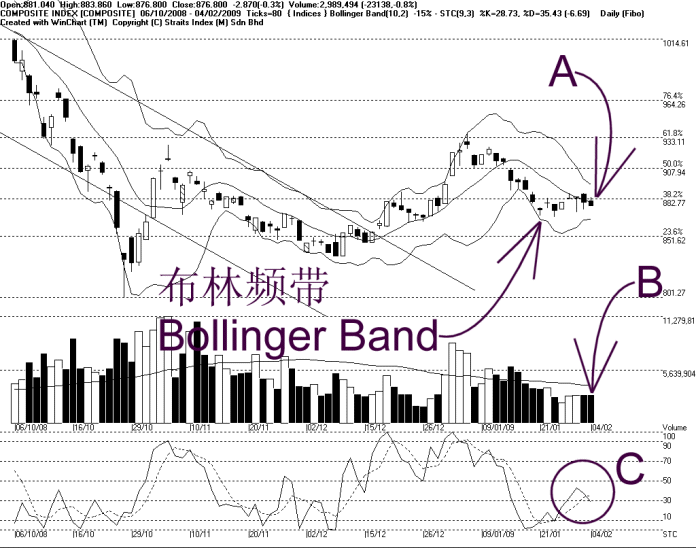
As indicated by A, the KLCI ended slightly lower despite most Asian markets ended higher. Meanwhile, the Bollinger Bands Width contracted another 15%, suggesting the KLCI is still consolidating, and if the KLCI should return to its positive territory, breaking above the Bollinger Middle Band is imperative.
Other than the Bollinger Middle Band dynamic resistance line, the 887 WinChart Automatic Fibonacci Retracement is still the resistance for the KLCI; while the other supports are still at 869 and 853 WinChart Automatic Fibonacci Retracement.
As indicated by B, total market volume declined 0.8%, and as a result, the volume is still below the 40-day VMA level. This, once again, showing that the overall market participation is indeed insufficient, thus the KLCI is likely to consolidate.
As circled at C, the Stochastic is touching the 30% level, and if the Stochastic should break below 30% level, it would be entering the short term bearish region; and therefore, if the Stochastic should remain below 30% level, the market movement for the short term is expected to be bearish biased.
Despite some short term bearish biased view, the KLCI is still at its consolidation, while preparing for a new movement; and the direction of the new movement will only be determined once the Bollinger Bands Width re-expands.
Find this analysis useful? Why not share it with others? Click Here to send this to a friend
 1st Online Training In Malaysia |
 |
 |
 |
| View the Online Training | More Market Analysis | Find out more about WinChart | Upcoming Events |
Straits Index (M)
Sdn Bhd
No. 16, Jalan LP 1A / 5, Lestari Perdana,
43300 Seri Kembangan, Selangor
Hotline: (03) 8941 6828 (5
lines) Fax: (03) 8941 9828
Email: info@straitsindex.com
© Copyright 1997-2008 Straits Index (M) Sdn Bhd All
rights reserved