WinChart Technical Analysis
Daily Market analysis
| Learn Technical Analysis and get your credit hours at the same time. WinChart Technical Analysis Training is Accredited by: | |||
 |
 |
||
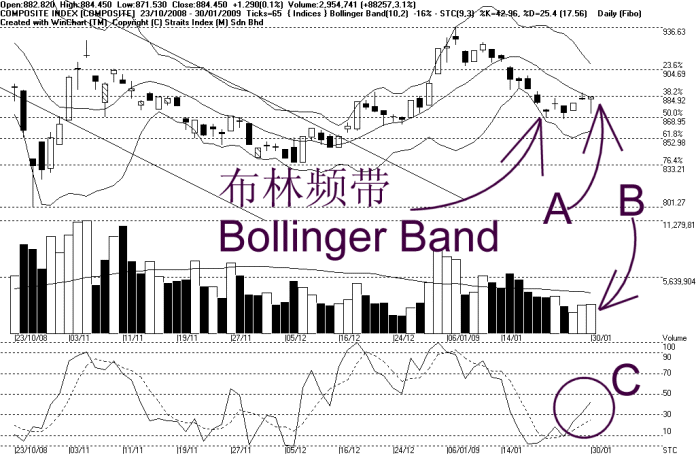
As indicated by A, despite an attempt to rebound from early losses, the KLCI is still resisted by the Bollinger Middle Band dynamic resistance. Other resistance for the KLCI is at 887 WinChart Automatic Fibonacci Retracement while the supports are still at 869 and 853 WinChart Automatic Fibonacci Retracement.
Meanwhile, as shown on the chart above, the Bollinger Bands width contracted another 16%, suggesting the KLCI is still consolidating after falling, thus a technical rebound.
As indicated by B, total market volume increased 3.1%, and still, the volume is below the 40-day VMA level, suggesting that the market participation is still relatively low. Therefore, the KLCI is likely to consolidate with insufficient market participation.
As circled at C, the Stochastic is still rising after breaking above 30% level, suggesting that the technical rebound of the KLCI continues. If the Stochastic should break above 70% level, it would be a short term bullish signal for the KLCI.
To sum up, the KLCI is still testing the Bollinger Middle Band dynamic resistance, and until the Bollinger Middle Band is successfully taken out, the immediate outlook for the KLCI is still bearish biased.
Find this analysis useful? Why not share it with others? Click Here to send this to a friend
 1st Online Training In Malaysia |
 |
 |
 |
| View the Online Training | More Market Analysis | Find out more about WinChart | Upcoming Events |
Straits Index (M)
Sdn Bhd
No. 16, Jalan LP 1A / 5, Lestari Perdana,
43300 Seri Kembangan, Selangor
Hotline: (03) 8941 6828 (5
lines) Fax: (03) 8941 9828
Email: info@straitsindex.com
© Copyright 1997-2008 Straits Index (M) Sdn Bhd All
rights reserved