WinChart Technical Analysis
Daily Market analysis
| Learn Technical Analysis and get your credit hours at the same time. WinChart Technical Analysis Training is Accredited by: | |||
 |
 |
||
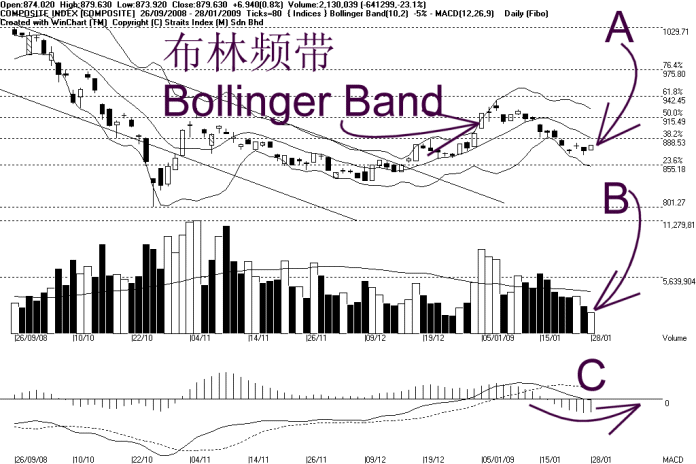
As indicated by A, the KLCI rebounded 6.94 points on Wednesday, but still below the Bollinger Middle Band. Resistance for the KLCI is still at 887 WinChart Automatic Fibonacci Retracement while the supports are still seen at 869 followed by 853 WinChart Automatic Fibonacci Retracement.
As shown on the chart above, the Bollinger Bands Width contracted 5%, suggesting that the KLCI is consolidating again after falling for about a week. Again, the KLCI has to break above the Bollinger Middle Band, or the rebound of the KLCI can only be viewed as technical rebound.
As indicated by B, total market volume declined 23% on the first trading day after the festive holiday, suggesting that the market participation is still very low, as investors are still on the sidelines. Therefore, without sufficient volume, the KLCI is likely to consolidate.
As indicated by C, the MACD histogram begin to tick up, and therefore, might be forming a rounding bottom. If the MACD histogram should form a rounding bottom, it would be a signal suggesting the KLCI is regaining its strength.
In conclusion, the KLCI is now technically rebounding, while likely to consolidate after the rebound, unless it could break above the Bollinger Middle Band with strong volume.
Find this analysis useful? Why not share it with others? Click Here to send this to a friend
 1st Online Training In Malaysia |
 |
 |
 |
| View the Online Training | More Market Analysis | Find out more about WinChart | Upcoming Events |
Straits Index (M)
Sdn Bhd
No. 16, Jalan LP 1A / 5, Lestari Perdana,
43300 Seri Kembangan, Selangor
Hotline: (03) 8941 6828 (5
lines) Fax: (03) 8941 9828
Email: info@straitsindex.com
© Copyright 1997-2008 Straits Index (M) Sdn Bhd All
rights reserved