WinChart Technical Analysis
Daily Market analysis

| Learn Technical Analysis and get your credit hours at the same time. WinChart Technical Analysis Training is Accredited by: | |||
 |
 |
||
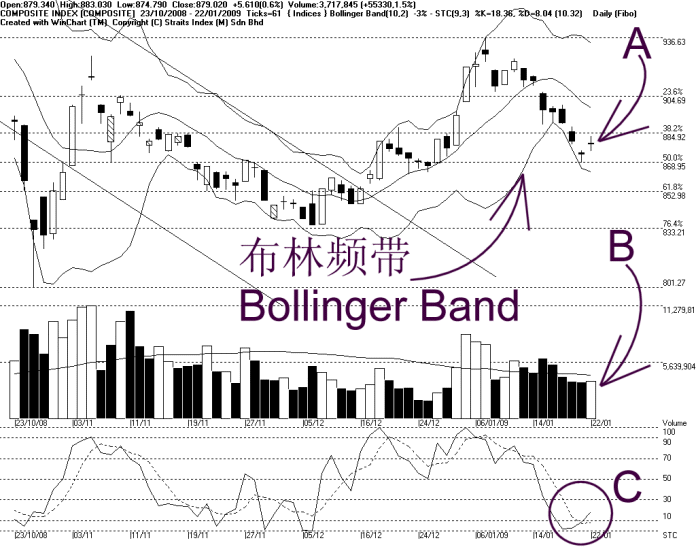
On Thursday, the KLCI had a minor rebound, closing 0.6% higher as indicated by A. The KLCI formed a doji (Cross) candlestick, suggesting that the market movement on Thursday was mixed, as the direction of the KLCI remains unclear. Resistance for the KLCI remains at 887 WinChart Automatic Fibonacci Retracement while the supports are still seen at 869 followed by 853 WinChart Automatic Fibonacci Retracement.
As shown on the chart above, the Bollinger Bands Width contracted 3%, suggesting the KLCI is likely to consolidate. But still, in order to break away from the bearish biased movement, the KLCI has to break above the Bollinger Middle Band.
As indicated by B, total market volume increased 1.5%, but still below the 40-day VMA level. This show that the market overall is still lightly participated as many investors are still staying on the sidelines as the festive holiday is drawing closer. Nevertheless, the lower volume during a consolidation market is considered normal.
As circled at C, the Stochastic %K line successfully crossed above the %D line, as mentioned on Wednesday's analysis, implying a possible technical rebound in the near future. But still, the Stochastic has to break above 30% level in order to signal a beginning of a technical rebound.
In conclusion, the KLCI rebounded slightly after being over-sold (Stochastic hitting 0%), but still remain below the Bollinger Middle Band. Therefore, the immediate outlook for the KLCI is still bearish biased, and the rebound on Thursday is only considered as a technical rebound.
Find this analysis useful? Why not share it with others? Click Here to send this to a friend
 1st Online Training In Malaysia |
 |
 |
 |
| View the Online Training | More Market Analysis | Find out more about WinChart | Upcoming Events |
Straits Index (M)
Sdn Bhd
No. 16, Jalan LP 1A / 5, Lestari Perdana,
43300 Seri Kembangan, Selangor
Hotline: (03) 8941 6828 (5
lines) Fax: (03) 8941 9828
Email: info@straitsindex.com
© Copyright 1997-2008 Straits Index (M) Sdn Bhd All
rights reserved