WinChart Technical Analysis
Daily Market analysis

| Learn Technical Analysis and get your credit hours at the same time. WinChart Technical Analysis Training is Accredited by: | |||
 |
 |
||
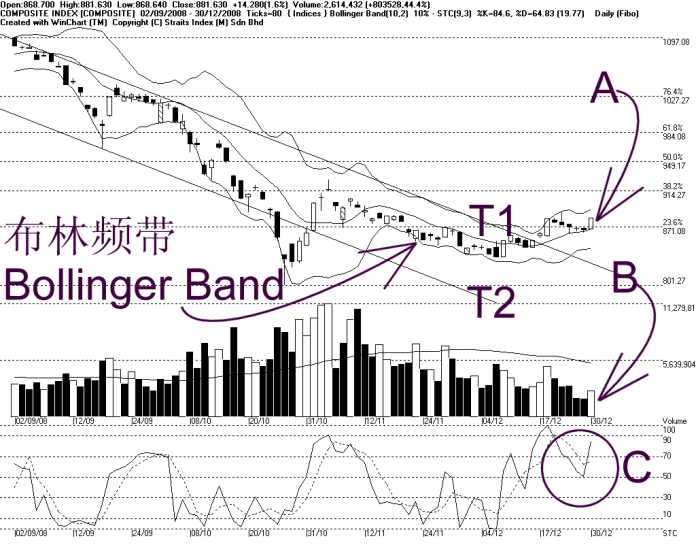
As indicated by A, the KLCI rebounded precisely above the Bollinger Middle Band on Tuesday, closing 1.6% higher. As a result, the Bollinger Bands Width also begins to expand, suggesting some bullish biased signal for the KLCI. However, the KLCI is still capped by the 887 WinChart Automatic Fibonacci Retracement resistance, and the next resistance would be at the 900 level.
As shown on the chart above, the Bollinger Middle Band continues to serve as the dynamic support for the KLCI, and as long as the KLCI is still supported by the rising Bollinger Middle Band, the immediate outlook for the KLCI is still on the positive side. As the KLCI steered away from the T1 and T2 downtrend channel, it is likely to break away from the downtrend.
As indicated by B, total market volume on Tuesday increased 44.4%, but still further below the 40-day VMA level. This shows that the overall market participation is still relative insufficient, as most investors are still on the sidelines. In short, volume must increase to confirm the KLCI bullish movement.
As circled at C, the Stochastic breaks above the 70% level again on Tuesday, entering the short term bullish region. If the Stochastic should remain above 70% level, the market movement for the short term is likely to be bullish biased.
The Bollinger Bands Width expanded 10% on Tuesday, with the KLCI above the Bollinger Middle Band, therefore, suggesting a bullish biased signal for the KLCI. As long as the Bollinger Bands Width is still expanding, the bullish movement of the KLCI is expected to continue.
Find this analysis useful? Why not share it with others? Click Here to send this to a friend
 1st Online Training In Malaysia |
 |
 |
 |
| View the Online Training | More Market Analysis | Find out more about WinChart | Upcoming Events |
Straits Index (M)
Sdn Bhd
No. 16, Jalan LP 1A / 5, Lestari Perdana,
43300 Seri Kembangan, Selangor
Hotline: (03) 8941 6828 (5
lines) Fax: (03) 8941 9828
Email: info@straitsindex.com
© Copyright 1997-2008 Straits Index (M) Sdn Bhd All
rights reserved