WinChart Technical Analysis
Daily Market analysis

| Learn Technical Analysis and get your credit hours at the same time. WinChart Technical Analysis Training is Accredited by: | |||
 |
 |
||
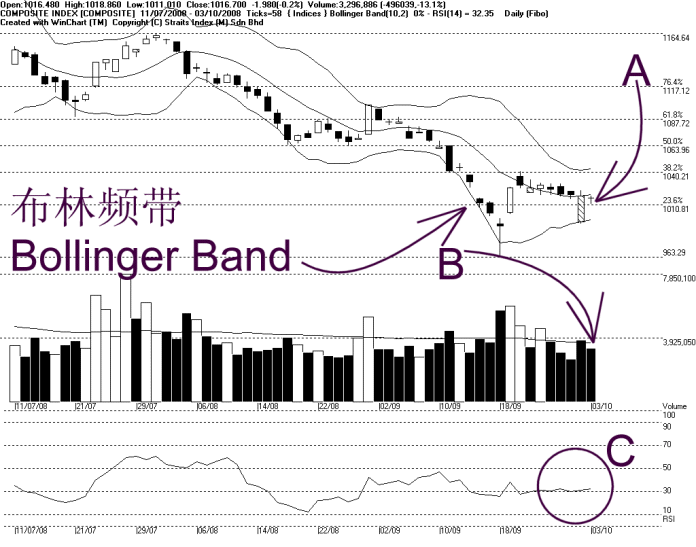
The KLCI ended almost unchanged while continue its consolidation, despite regional markets closing mostly lower. As indicated by A, the KLCI managed to rebound at the 1011 WinChart Automatic Fibonacci Retracement, and therefore, the 1011 WinChart Automatic Fibonacci Retracement is still the support for the KLCI, while the resistance is at the Bollinger Middle Band dynamic resistance.
Meanwhile, the Bollinger Bands Width expanded 0%, suggesting the KLCI is still consolidating and the market direction is expected to be unclear. The consolidation of the KLCI suggests a preparation of a new movement, and the new movement will only be revealed when the Bollinger Bands Width re-expands. If the KLCI should stay above the Bollinger Middle Band when the Bollinger Bands Width re-expands, it would be a bullish biased signal. However, if the KLCI should stay below the Bollinger Middle Band when the Bollinger Bands Width re-expands, it would be a bearish biased signal.
As indicated by B, total market volume declined 13.1%, staying below the 40-day VMA level. This suggests that the overall market participation is still relatively low. Again, it is rather normal to have a lower volume during the KLCI consolidation.
As circled at C, the WinChart RSI is still wandering at the 30% level, suggesting the mid term market sentiment is still in the neutral region, but with some slight bearish biased. This is typical for the WinChart RSI for the KLCI is still moving in its sideways movement.
Find this analysis useful? Why not share it with others? Click Here to send this to a friend
 1st Online Training In Malaysia |
 |
 |
 |
| View the Online Training | More Market Analysis | Find out more about WinChart | Upcoming Events |
Straits Index (M)
Sdn Bhd
No. 16, Jalan LP 1A / 5, Lestari Perdana,
43300 Seri Kembangan, Selangor
Hotline: (03) 8941 6828 (5
lines) Fax: (03) 8941 9828
Email: info@straitsindex.com
© Copyright 1997-2008 Straits Index (M) Sdn Bhd All
rights reserved