WinChart Technical Analysis
Daily Market analysis

| Learn Technical Analysis and get your credit hours at the same time. WinChart Technical Analysis Training is Accredited by: | |||
 |
 |
||
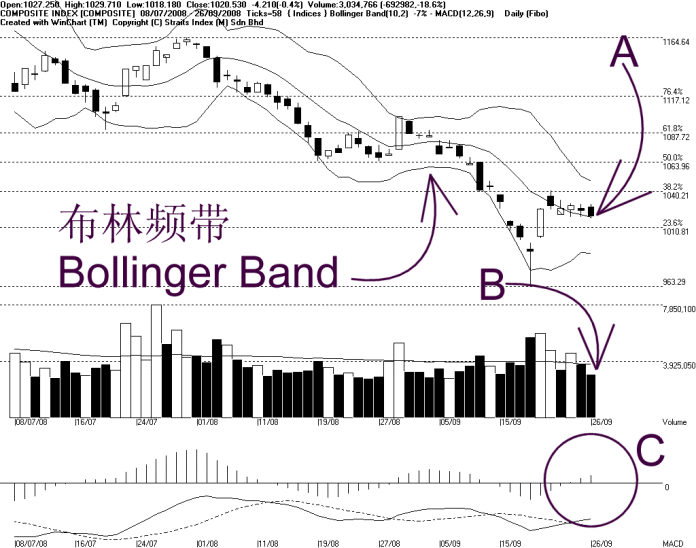
As indicated by A, the KLCI ended slightly lower while still staying above the Bollinger Middle Band, and therefore, the Bollinger Middle Band is serving as the dynamic support for the KLCI. If the KLCI should break below the Bollinger Middle Band, the immediate outlook for the KLCI shall turn bearish biased.
As shown on the chart, the Bollinger Bands Width contracted another 7%, suggesting the KLCI is still consolidating. The contraction of the Bollinger Bands Width also suggesting the KLCI is gearing up for a new movement and when the Bollinger Bands Width re-expands, it would be a signal suggesting a beginning of a new movement.
As shown on the chart, the Bollinger Bands Width is still contracting 21%, thus suggesting a consolidation for the KLCI. If the Bollinger Bands Width should continue to contract, the KLCI is expected to continue its sideways movement until the Bollinger Bands Width re-expands.
As indicated by B, total market volume fell 18.6% on Friday, while stays below the 40-day VMA level. This shows that the overall market is lightly participated. Therefore, the KLCI is less likely to pick up its strength, and is likely to continue its consolidation.
As circled at C, the MACD histogram has not shown a rounding top yet, even though the rising is slowing down. If the MACD histogram should form a rounding top, it would be a signal suggesting a weakening of the KLCI short term movement. However, if the KLCI should continue its sideways movement, the significance of the MACD histogram signal is reduced.
Find this analysis useful? Why not share it with others? Click Here to send this to a friend
 1st Online Training In Malaysia |
 |
 |
 |
| View the Online Training | More Market Analysis | Find out more about WinChart | Upcoming Events |
Straits Index (M)
Sdn Bhd
No. 16, Jalan LP 1A / 5, Lestari Perdana,
43300 Seri Kembangan, Selangor
Hotline: (03) 8941 6828 (5
lines) Fax: (03) 8941 9828
Email: info@straitsindex.com
© Copyright 1997-2008 Straits Index (M) Sdn Bhd All
rights reserved