WinChart Technical Analysis
Daily Market analysis

| Learn Technical Analysis and get your credit hours at the same time. WinChart Technical Analysis Training is Accredited by: | |||
 |
 |
||
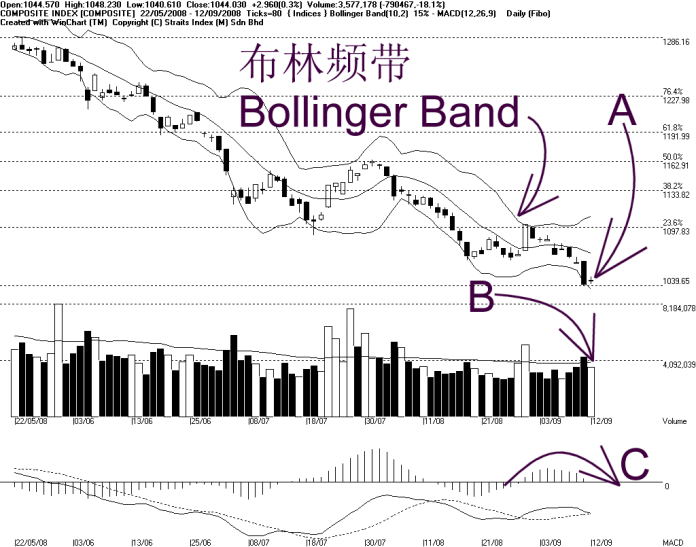
As indicated by A, the KLCI rebounded 2.96 points, and therefore, the 1040 points is the temporary support for the KLCI, while the 1035 WinChart Automatic Fibonacci Retracement is still the support, and the resistance remains at 1064 WinChart Automatic Fibonacci Retracement.
As shown on the chart, the Bollinger Bands Width is still expanding (15%) with the KLCI situated below the Bollinger Middle Band, therefore, the rebound on Friday is only considered as a technical rebound. Nevertheless, if the Bollinger Bands Width should begin to contract, it would be a signal suggesting that the KLCI will consolidate.
As indicated by B, total market volume dropped 18.1%, and the volume is now back to below 40-day VMA level, this suggests that the overall market participation is still low, and there is still no sign of gaining strength for the KLCI.
As circled at C, the MACD histogram is still showing a rounding top, suggesting that the weakening short term movement for the KLCI is still intact; the weak short term movement for the KLCI is expected to continue until the MACD histogram forms a rounding bottom.
Meanwhile, readers can monitor the Stochastic, for if the Stochastic should break above the 30% level, it would be a signal suggesting a beginning of a technical rebound, thus the KLCI might have a chance to pick up some strength.
Find this analysis useful? Why not share it with others? Click Here to send this to a friend
 1st Online Training In Malaysia |
 |
 |
 |
| View the Online Training | More Market Analysis | Find out more about WinChart | Upcoming Events |
Straits Index (M)
Sdn Bhd
No. 16, Jalan LP 1A / 5, Lestari Perdana,
43300 Seri Kembangan, Selangor
Hotline: (03) 8941 6828 (5
lines) Fax: (03) 8941 9828
Email: info@straitsindex.com
© Copyright 1997-2008 Straits Index (M) Sdn Bhd All
rights reserved