WinChart Technical Analysis
Daily Market analysis

| Learn Technical Analysis and get your credit hours at the same time. WinChart Technical Analysis Training is Accredited by: | |||
 |
 |
||
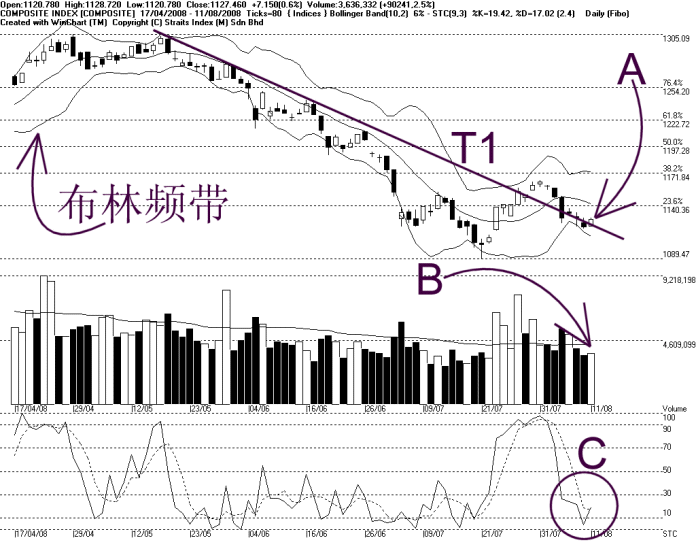
As indicated by A, the KLCI rebounded on Monday, closing above the T1 line, suggesting the KLCI is supported by the T1 line. Nevertheless, the KLCI has to break above the recent high on 31st of July in order to breakout from the T1 downtrend successfully. Support for the KLCI remains at 1089 WinChart Automatic Fibonacci Retracement while the resistance is still at 1140 WinChart Automatic Fibonacci Retracement.
As indicated by B, total market volume increased 2.5%, but it is still below the 40-day VMA level, suggesting that the current market participation is still insufficient. Generally, total market volume has to remain above the 40-day VMA level to sustain the KLCI rally.
As circled at C, the Stochastic rebounded slightly on Monday, suggesting a slight improvement for the KLCI short term movement. Nevertheless, the Stochastic has to break above the 30% level to end the short term bearish signal, which is also a signal of a short term technical rebound. Generally, the Stochastic has to break and maintain above the 70% level in order to signal a short term bullish movement for the FBM2nd Board Index.
Find this analysis useful? Why not share it with others? Click Here to send this to a friend
 1st Online Training In Malaysia |
 |
 |
 |
| View the Online Training | More Market Analysis | Find out more about WinChart | Upcoming Events |
Straits Index (M)
Sdn Bhd
No. 16, Jalan LP 1A / 5, Lestari Perdana,
43300 Seri Kembangan, Selangor
Hotline: (03) 8941 6828 (5
lines) Fax: (03) 8941 9828
Email: info@straitsindex.com
© Copyright 1997-2008 Straits Index (M) Sdn Bhd All
rights reserved