WinChart Technical Analysis
Daily Market analysis

| Learn Technical Analysis and get your credit hours at the same time. WinChart Technical Analysis Training is Accredited by: | |||
 |
 |
||
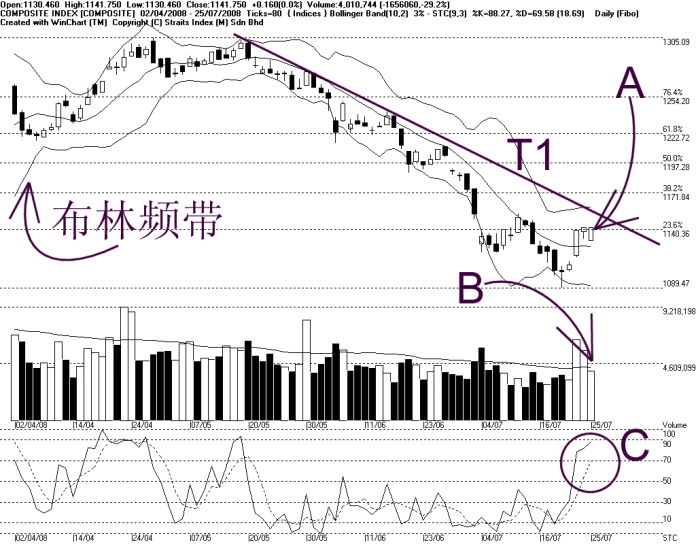
Since the regional markets were having a technical correction, the KLCI was also lower in the early trade; however, it managed to close 0.16 points higher at the end. As indicated by A, the KLCI is still testing the 1140 WinChart Automatic Fibonacci Retracement line. Next resistance for the KLCI is at 1172 WinChart Automatic Fibonacci Retracement line.
As shown on the chart, the T1 downtrend line remains intact as it is also another resistance for the KLCI. If the KLCI should break above the T1, it would end the downtrend which lasted for 2 months. The Bollinger Bands Width expanded 3% on Friday, and the KLCI is still situated above the Bollinger Middle Band. Generally, the direction for the KLCI would be clearer if the Bollinger Bands Width should expand significantly.
As indicated by B, total market volume declined 29.2%, and as a result, the volume failed to stay above the 40-day VMA level. This suggests that investors are still being cautious while staying on the sidelines. In other words, volume has to stay above the 40-day VMA level in order for the KLCI to regian its strength.
As circled at C, despite the early losses of the KLCI, the Stochastic remains above the 70% level, and suggesting a short term bullish signal. The short term bullish signal is expected to continue until the Stochastic should break below the 70% level.
Find this analysis useful? Why not share it with others? Click Here to send this to a friend
 1st Online Training In Malaysia |
 |
 |
 |
| View the Online Training | More Market Analysis | Find out more about WinChart | Upcoming Events |
Straits Index (M)
Sdn Bhd
No. 16, Jalan LP 1A / 5, Lestari Perdana,
43300 Seri Kembangan, Selangor
Hotline: (03) 8941 6828 (5
lines) Fax: (03) 8941 9828
Email: info@straitsindex.com
© Copyright 1997-2008 Straits Index (M) Sdn Bhd All
rights reserved