WinChart Technical Analysis
Daily Market analysis

| Learn Technical Analysis and get your credit hours at the same time. WinChart Technical Analysis Training is Accredited by: | |||
 |
 |
||
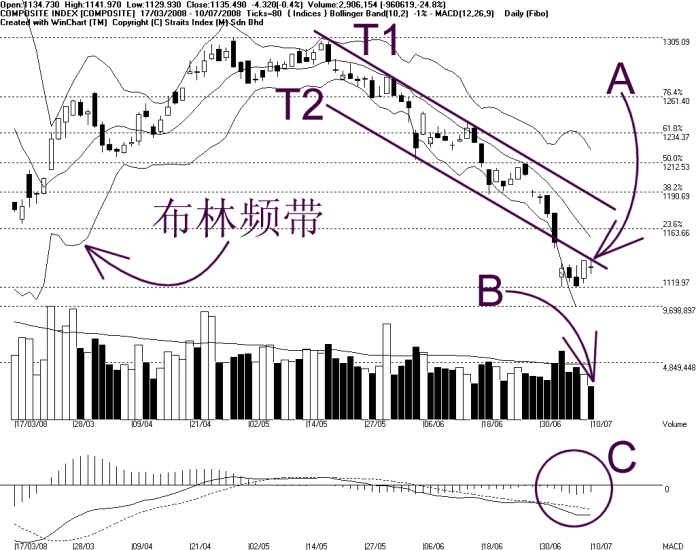
As indicated by A, the KLCI attempted to test the the T2 downtrend resistance line, and remains resisted. Therefore, the T2 is still the resistance line. Meanwhile, as shown on the chart, the Bollinger Bands Width begins to contract, suggesting that the KLCI is likely to consolidate. Generally, as the KLCI consolidate after falling, the target shall be at the Bollinger Middle Band. If the KLCI should retreat after hitting the Bollinger Middle Band, the rally would be considered a technical rebound.
Nevertheless, the support for the KLCI remains at 1120 Fibonacci line and the resistance is at 1164 WinChart Automatic Fibonacci Retracement line, as well as the Bollinger Middle Band dynamic resistance.
As indicated by B, total market volume declined another 24.8% on Thursday, and therefore, the total market volume failed to break above the 40-day VMA level. This suggests that the market participation is still quiet as most investors are still staying on the sidelines.
As circled at C, the MACD histogram begins rising and about to form a rounding bottom. If the MACD histogram form a rounding bottom successfully, it would be a sign of a technical rebound. However, as for the longer term view, the KLCI remains bearish biased for the MACD line is still staying below the zero level.
Find this analysis useful? Why not share it with others? Click Here to send this to a friend
 1st Online Training In Malaysia |
 |
 |
 |
| View the Online Training | More Market Analysis | Find out more about WinChart | Upcoming Events |
Straits Index (M)
Sdn Bhd
No. 16, Jalan LP 1A / 5, Lestari Perdana,
43300 Seri Kembangan, Selangor
Hotline: (03) 8941 6828 (5
lines) Fax: (03) 8941 9828
Email: info@straitsindex.com
© Copyright 1997-2008 Straits Index (M) Sdn Bhd All
rights reserved