WinChart Technical Analysis
Daily Market analysis

| Learn Technical Analysis and get your credit hours at the same time. WinChart Technical Analysis Training is Accredited by: | |||
 |
 |
||
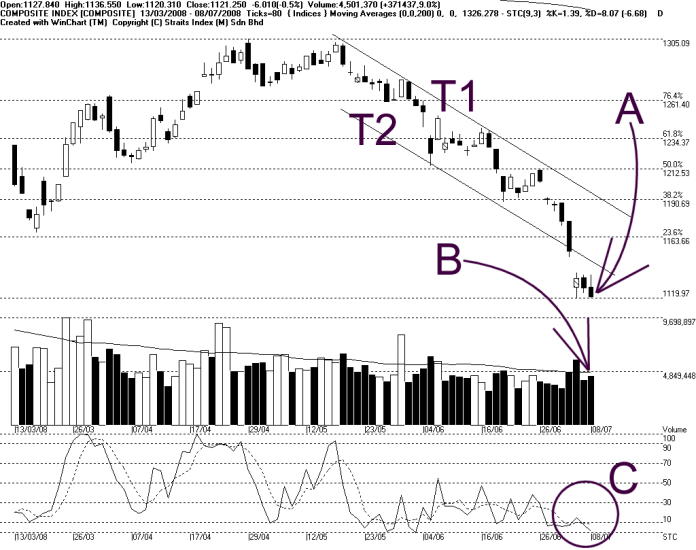
On Tuesday, the KLCI ended 6.01 points as the regional markets ended lower. As indicated by A, the KLCI is temporary supported by the 1120 WinChart Automatic Fibonacci Retracement line. If the KLCI should break below this level, the next support for the KLCI will be at 1100 level. Nevertheless, the resistance for the KLCI is seen at 1164 points.
As shown on the chart above, as the KLCI breaks below the T1 and T2 downtrend channel, it also break below the Bollinger lower band, which suggests that the KLCI was over-sold. Therefore, there is a chance for the KLCI to rebound or to consolidate sideways. Therefore, it is a good time to monitor the Bollinger Bands Width. If the Bollinger Bands Width should begin to contact, it would suggests a consolidation for the KLCI. However, if the Bollinger Bands Width should expands again with the KLCI staying below the Bollinger Middle Band, there would be more downside risk for the KLCI.
As indicated by B, total market volume increased 9% on Tuesday, and it is now closer to the 40-day VMA level again. This is a sign of improvement of the market participation. But still, if the KLCI should attempt to rebound or regain its strength, more volume above the 40-day VMA level is needed, or the rebound would be rather weak.
As circled at C, the Stochastic continues staying below the 30% level, which is the short term bearish region. If the Stochastic should break above the 30% level, it would be a signal suggesting a beginning of a technical rebound.
Find this analysis useful? Why not share it with others? Click Here to send this to a friend
 1st Online Training In Malaysia |
 |
 |
 |
| View the Online Training | More Market Analysis | Find out more about WinChart | Upcoming Events |
Straits Index (M)
Sdn Bhd
No. 16, Jalan LP 1A / 5, Lestari Perdana,
43300 Seri Kembangan, Selangor
Hotline: (03) 8941 6828 (5
lines) Fax: (03) 8941 9828
Email: info@straitsindex.com
© Copyright 1997-2008 Straits Index (M) Sdn Bhd All
rights reserved