WinChart Technical Analysis
Daily Market analysis

| Learn Technical Analysis and get your credit hours at the same time. WinChart Technical Analysis Training is Accredited by: | |||
 |
 |
||
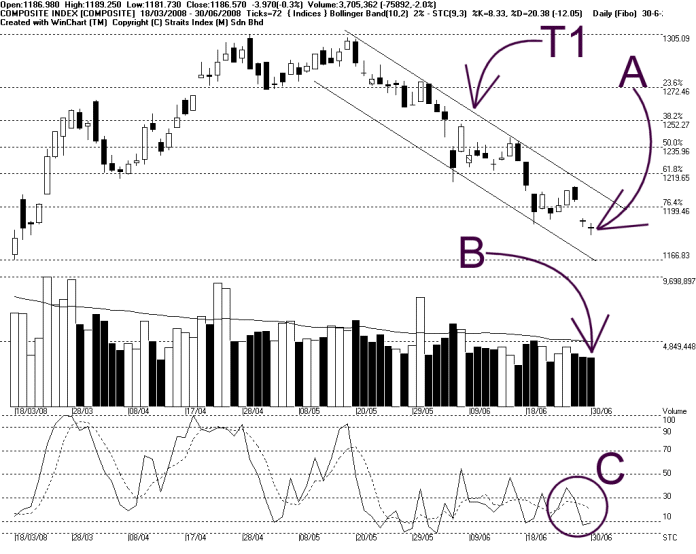
As shown on the chart, the KLCI remains in the downtrend channel; until the KLCI successfully breaking above the downtrend channel resistance (T1), the outlook for the KLCI remains bearish biased. As indicated by A, the KLCI formed a Doji candlestick, which is the mixed signal for the day, and suggesting a chance of a technical rebound.
As indicated by b, total market volume remains below the 40-day VMA level, suggesting that the market participation is still low, as investors are still staying on the side lines. In short, if the market volume should remain below the 40-day VMA level, the KLCI is less likely to regain its strength.
As circled at C, the Stochastic is still staying below the 30% level, which is the short term bearish region. Therefore, the market movement for the short term is still bearish biased; unless the Stochastic could successfully break out above the 30% level, it would be a sign of a technical rebound, and the KLCI would have a chance to regain some lost ground.
Find this analysis useful? Why not share it with others? Click Here to send this to a friend
 1st Online Training In Malaysia |
 |
 |
 |
| View the Online Training | More Market Analysis | Find out more about WinChart | Upcoming Events |
Straits Index (M)
Sdn Bhd
No. 16, Jalan LP 1A / 5, Lestari Perdana,
43300 Seri Kembangan, Selangor
Hotline: (03) 8941 6828 (5
lines) Fax: (03) 8941 9828
Email: info@straitsindex.com
© Copyright 1997-2008 Straits Index (M) Sdn Bhd All
rights reserved