WinChart Technical Analysis
Daily Market analysis

| Learn Technical Analysis and get your credit hours at the same time. WinChart Technical Analysis Training is Accredited by: | |||
 |
 |
||
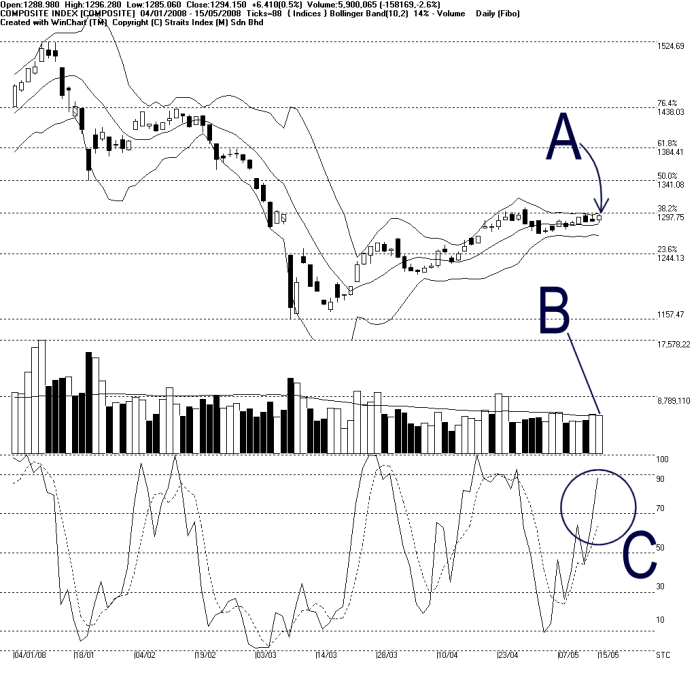
As indicated by A, the KLCI tested the 1297 resistance again on Thursday with a daily high reaching 1296.28 points. However, the resistance remains intact, and therefore, the KLCI is still capped under the 1300 psychological level. Nevertheless, the Bollinger Bands Width expanded 14% on Thursday, suggesting some increase of volatility. Therefore, if the Bollinger Bands Width should continue expanding, while the KLCI remain above the Bollinger Middle Band, the immediate outlook is expected to improve. Next resistance for the KLCI is seen at 1340 (neck line of the Head and Shoulder Top).
As indicated by B, total market volume declined 2.6%, and barely touching the 40-day VMA level. Therefore, the unconvincing market participation is still the set back for the KLCI performance. Nevertheless, should volume increase, the KLCI would have a better chance to break out from the 1300 resistance.
As circled at C, the Stochastic %K line breaks above the 70% level on Thursday, giving an unconfirmed short term bullish signal. If the Stochastic %D line should also break above the 70% level, it would confirm the %K line signal, and the market movement for the short term would be bullish biased.
Find this analysis useful? Why not share it with others? Click Here to send this to a friend
 1st Online Training In Malaysia |
 |
 |
 |
| View the Online Training | More Market Analysis | Find out more about WinChart | Upcoming Events |
Straits Index (M)
Sdn Bhd
No. 16, Jalan LP 1A / 5, Lestari Perdana,
43300 Seri Kembangan, Selangor
Hotline: (03) 8941 6828 (5
lines) Fax: (03) 8941 9828
Email: info@straitsindex.com
© Copyright 1997-2008 Straits Index (M) Sdn Bhd All
rights reserved