WinChart Technical Analysis
Daily Market analysis

| Learn Technical Analysis and get your credit hours at the same time. WinChart Technical Analysis Training is Accredited by: | |||
 |
 |
||
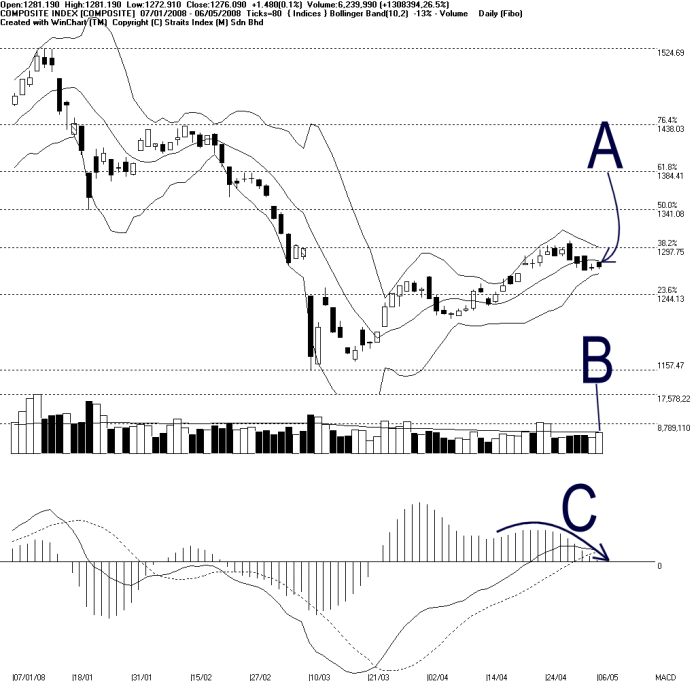
As indicated by A, the Bollinger Bands Width further contracted another 13% on Tuesday, suggesting that the consolidation of the KLCI continues. Therefore, the market direction is still unclear as the KLCI is consolidating. It is worth paying attention to the Bollinger Bands Width development as the Bollinger Bands Width expands, it would suggests a beginning of a new direction. Nevertheless, resistance for the KLCI is still seen at 1300 while the support is still at 1244 Fibonacci Retirement line.
As indicated by B, total market volume increased 26.5% on Tuesday, while almost breaking above the 40-day VMA level. If the market volume should break above and maintain above the 40-day VMA level, it would suggests that the market participation is sufficient, and the KLCI would have a chance to end this consolidation and test the resistance at 1300 level.
As indicated by C, the MACD histogram is still falling on Tuesday, suggesting that the MACD bullish signal is still weakening, while the MACD line has not broken below the trigger line. If the MACD histogram should form a rounding bottom, it would be a continuation of the MACD bullish signal.
Find this analysis useful? Why not share it with others? Click Here to send this to a friend
 1st Online Training In Malaysia |
 |
 |
 |
| View the Online Training | More Market Analysis | Find out more about WinChart | Upcoming Events |
Straits Index (M)
Sdn Bhd
No. 16, Jalan LP 1A / 5, Lestari Perdana,
43300 Seri Kembangan, Selangor
Hotline: (03) 8941 6828 (5
lines) Fax: (03) 8941 9828
Email: info@straitsindex.com
© Copyright 1997-2008 Straits Index (M) Sdn Bhd All
rights reserved