WinChart Technical Analysis
Daily Market analysis

| Learn Technical Analysis and get your credit hours at the same time. WinChart Technical Analysis Training is Accredited by: | |||
 |
 |
||
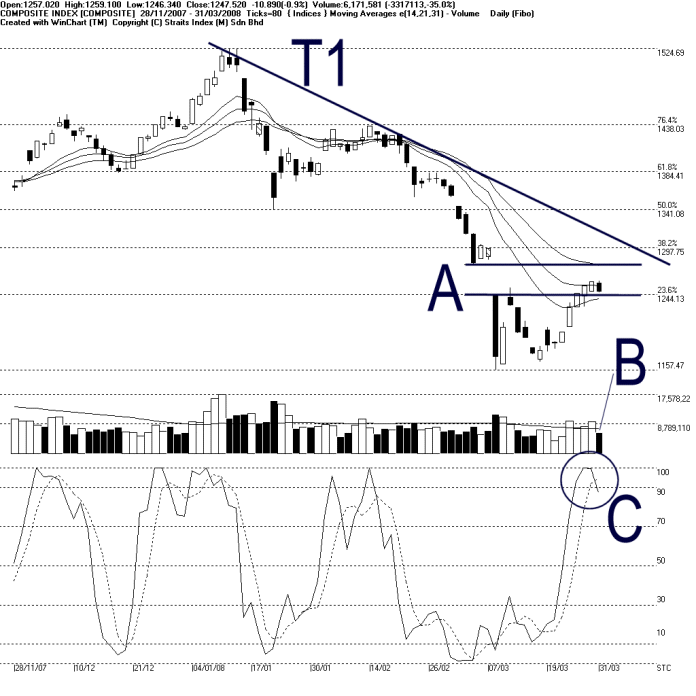
As indicated by A, the KLCI stays in the congestion zone of the 14, 21, 31 EMA as well as resisted at the Gap (1244 1280). Meanwhile, the T1 downtrend line remains intact, and therefore, suggesting that the KLCI is still staying in the downtrend despite the recent well-favored rebound. Nevertheless, the recent rebound has definitely improved the market sentiment, and therefore, if the market volume should increase, the KLCI would have a better chance to break above the gap resistance.
As indicated by B, total market volume declined 35%. Based on the technical analysis point of view, if the KLCI should have a technical correction, a lower volume would suggests a healthy correction. However, if the KLCI should attempt to break the gap resistance, a stronger volume is needed.
As circled at C, the Stochastic %D line is above the 90% level, which is a short term over-bought signal, suggesting that the KLCI has gone over heated, and a technical correction is only normal. However, if the Stochastic should remain above the 70% level after the technical correction, the short term movement for the KLCI is still bullish biased.
Find this analysis useful? Why not share it with others? Click Here to send this to a friend
 1st Online Training In Malaysia |
 |
 |
 |
| View the Online Training | More Market Analysis | Find out more about WinChart | Upcoming Events |
Straits Index (M)
Sdn Bhd
No. 16, Jalan LP 1A / 5, Lestari Perdana,
43300 Seri Kembangan, Selangor
Hotline: (03) 8941 6828 (5
lines) Fax: (03) 8941 9828
Email: info@straitsindex.com
© Copyright 1997-2008 Straits Index (M) Sdn Bhd All
rights reserved