WinChart Technical Analysis
Daily Market analysis

| Learn Technical Analysis and get your credit hours at the same time. WinChart Technical Analysis Training is Accredited by: | |||
 |
 |
||
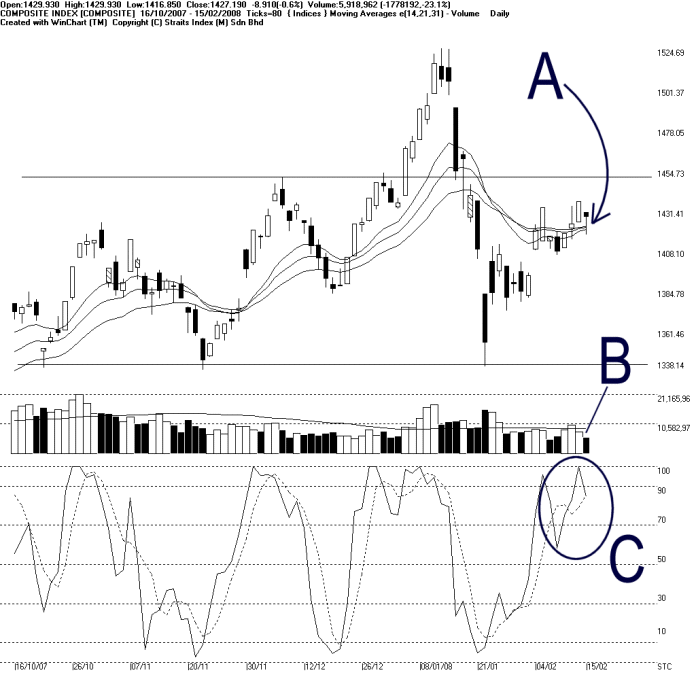
As indicated by A, the KLCI ended 8.91 points lower, to close at 1427.19 points. Currently, the KLCI remains in its sideways consolidation while still supported by the 14, 21 31 EMA. Nevertheless, the direction for the KLCI is still unclear with a resistance level at 1450 points.
As indicated by B, total market volume was 23.1% lower, and clearly staying below the 40-day VMA level. This shows that the overall market participation is still insufficient, as the inflow of fresh capital is still relatively low. In short, the KLCI is less likely to pick up its strength without sufficient participation.
As circled at C, the Stochastic is still situated above the 70% level, and therefore, still showing a short term bullish signal. If the Stochastic should fall below the 70% level, it would be a signal suggesting an end to the short term bullishness.
Find this analysis useful? Why not share it with others? Click Here to send this to a friend
 1st Online Training In Malaysia |
 |
 |
 |
| View the Online Training | More Market Analysis | Find out more about WinChart | Upcoming Events |
Straits Index (M)
Sdn Bhd
No. 16, Jalan LP 1A / 5, Lestari Perdana,
43300 Seri Kembangan, Selangor
Hotline: (03) 8941 6828 (5
lines) Fax: (03) 8941 9828
Email: info@straitsindex.com
© Copyright 1997-2008 Straits Index (M) Sdn Bhd All
rights reserved