Winchart Technical Analysis
Daily Market analysis

| Learn Technical Analysis and get your credit hours at the same time. WinChart Technical Analysis Training is Accredited by: | |||
 |
 |
||
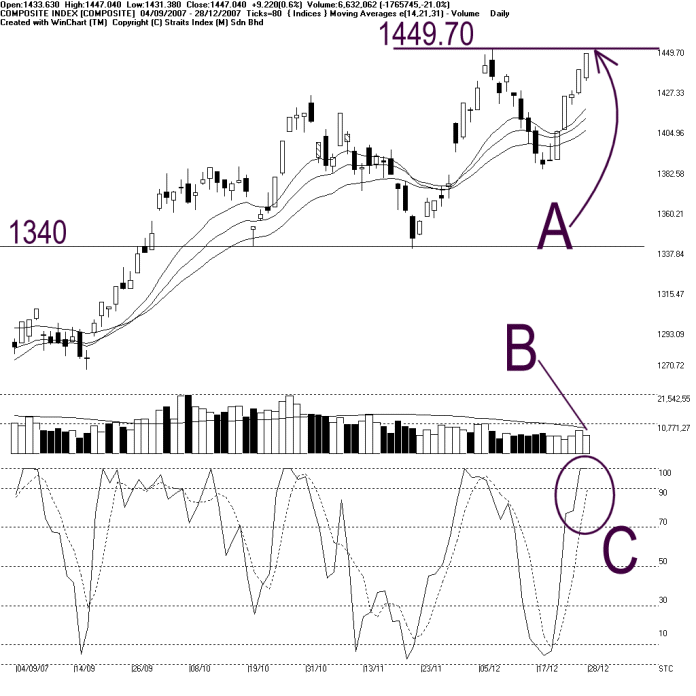
As indicated by A, the KLCI ended 9.22 points higher on Friday, and now it is testing the 1449.70 resistance. Meanwhile, the 14, 21, 31 EMA is still serving as the dynamic support for the KLCI, and if the KLCI should remains supported by the dynamic support, the immediate outlook for the KLCI is expected to be bullish biased.
Despite the KLCI ended higher, total market volume remains below the 40-day VMA level. As indicated by B, total market volume declined 21% on Friday. Therefore, this has failed to support the KLCI's attempt to test the 1449.70 resistance. Nevertheless, if the KLCI should break out from the resistance with thin volume, the sustainability of the bullish movement would be highly doubtful.
As circled at C, the Stochastic is now showing a short term bullish signal, with both the %K and %D line are situated above the 70% level. Therefore, provided that the Stochastic shall remains above the 70% level, the market movement for the short term is expected to be bullish biased.
Find this analysis useful? Why not share it with others? Click Here to send this to a friend
 1st Online Training In Malaysia |
 |
 |
 |
| View the Online Training | More Market Analysis | Find out more about WinChart | Upcoming Events |
Straits Index (M)
Sdn Bhd
No. 16, Jalan LP 1A / 5, Lestari Perdana,
43300 Seri Kembangan, Selangor
Hotline: (03) 8941 6828 (5
lines) Fax: (03) 8941 9828
Email: info@straitsindex.com
© Copyright 1997-2007 Straits Index (M) Sdn Bhd All
rights reserved