Winchart Technical Analysis
Daily Market analysis

| Learn Technical Analysis and get your credit hours at the same time. WinChart Technical Analysis Training is Accredited by: | |||
 |
 |
||
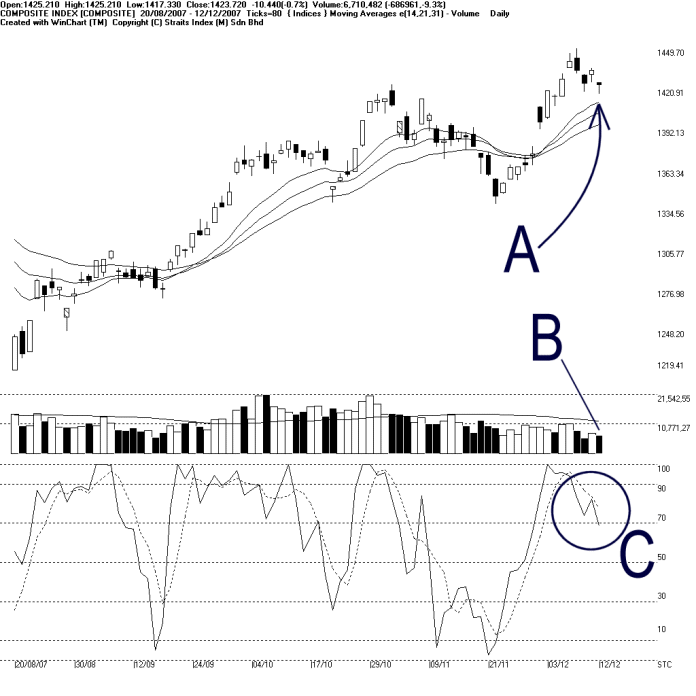
On Wednesday, the KLCI retreated 10.44 points to close at 1423.72 points. As indicated by A, the KLCI is now testing the 14, 21, 31 EMA dynamic support. If the KLCI should rebound from the dynamic support, there is a chance for the KLCI to resume its upward movement. Nevertheless, resistance for the KLCI remains at 1449.70.
As indicated by B, total market volume declined 9.3% on Wednesday. As you can see, volume remains below the 40-day VMA level, and it shows that the overall market participation is indeed insufficient. Therefore, provided that the volume is still below the 40-day VMA level, the KLCI is less likely to regain its strength.
As circled at C, the Stochastic %K line fall marginally below the 70% level on Wednesday. If the Stochastic %D should follow the %K line and break below the 70% level, it would suggests an end to the short term bullish signal, and the market movement for the short term would turn from bullish biased to neutral.
Find this analysis useful? Why not share it with others? Click Here to send this to a friend
 1st Online Training In Malaysia |
 |
 |
 |
| View the Online Training | More Market Analysis | Find out more about WinChart | Upcoming Events |
Straits Index (M)
Sdn Bhd
No. 16, Jalan LP 1A / 5, Lestari Perdana,
43300 Seri Kembangan, Selangor
Hotline: (03) 8941 6828 (5
lines) Fax: (03) 8941 9828
Email: info@straitsindex.com
© Copyright 1997-2007 Straits Index (M) Sdn Bhd All
rights reserved