Winchart Technical Analysis
Daily Market analysis

| Learn Technical Analysis and get your credit hours at the same time. WinChart Technical Analysis Training is Accredited by: | |||
 |
 |
||
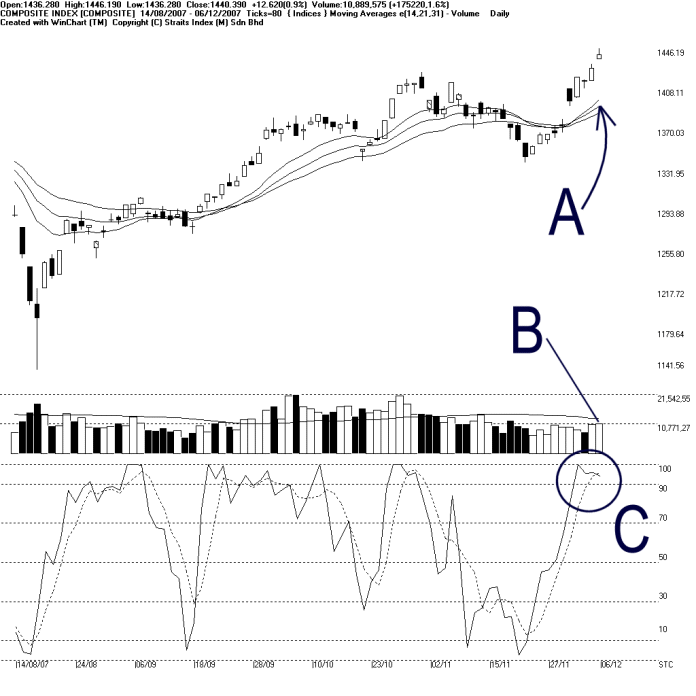
As shown on the chart above, the KLCI made yet another record high on Thursday with 1446.19 points. Therefore, as indicated by A, the 14, 21, 31 EMA shall continue serving as the dynamic support for the KLCI, and as long as the KLCI is still supported by the rising dynamic support, the movement is likely to bullish biased.
Again, the KLCI marked another new high with thin volume on Thursday. Total market volume increased a marginal 1.6% on Thursday, but as indicated by B, it is still below the 40-day VMA level, suggesting that the volume is indeed insufficient. Therefore, it failed to confirm the KLCI new high as there are not enough participation in the market.
As circled at C, the Stochastic is now above the 90% level, which is the short term bullish region but slightly over-bought. Therefore, this is usually an over-heated sign, suggesting that the KLCI is due for a technical correction. If the Stochastic should remain above the 70% level after the possible technical correction, the market movement for the short term is still bullish biased.
Find this analysis useful? Why not share it with others? Click Here to send this to a friend
 1st Online Training In Malaysia |
 |
 |
 |
| View the Online Training | More Market Analysis | Find out more about WinChart | Upcoming Events |
Straits Index (M)
Sdn Bhd
No. 16, Jalan LP 1A / 5, Lestari Perdana,
43300 Seri Kembangan, Selangor
Hotline: (03) 8941 6828 (5
lines) Fax: (03) 8941 9828
Email: info@straitsindex.com
© Copyright 1997-2007 Straits Index (M) Sdn Bhd All
rights reserved