Winchart Technical Analysis
Daily Market analysis

| Learn Technical Analysis and get your credit hours at the same time. WinChart Technical Analysis Training is Accredited by: | |||
 |
 |
||
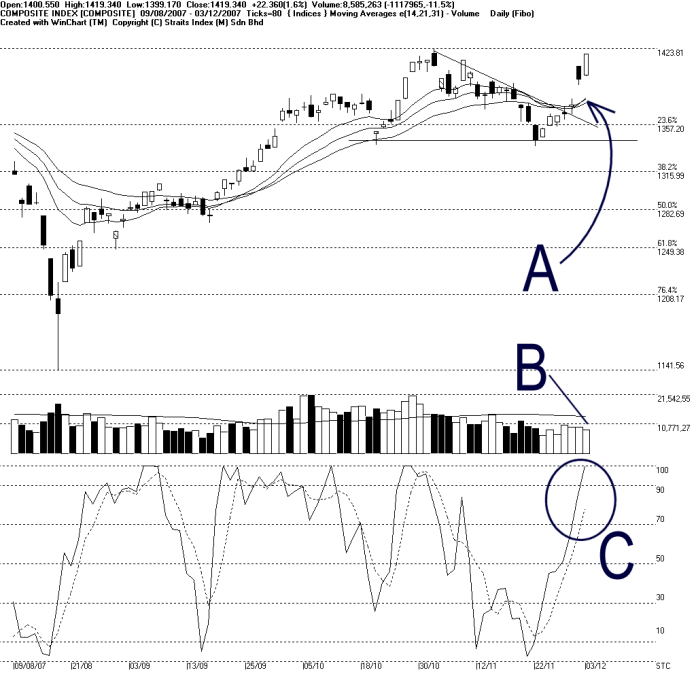
As shown on the chart above, the KLCI ended 22.36 pts higher to 1419.34 pts on Monday. Therefore, as indicated by A, the 14, 21, 31 EMA is still serving as the dynamic support for the KLCI. The KLCI is now set to retest the 1423.81 Resistance line.
However, as indicated by B, total market volume declined another 11.5% on Monday, while staying below the 40-day VMA level. Despite the KLCI ended higher, the declining volume fail to concur with the KLCI Monday's movement. Therefore, if the KLCI should attempt to break above the resistance with this thin volume, the sustainability and reliability would likely be low.
As circled at C, the Stochastic %D line entered above the 70% level. Therefore, the Stochastic is now showing a short term bullish signal. As long as the Stochastic is staying above the 70% level, its technical signal will suggests a short term bullish biased movement.
Find this analysis useful? Why not share it with others? Click Here to send this to a friend
 1st Online Training In Malaysia |
 |
 |
 |
| View the Online Training | More Market Analysis | Find out more about WinChart | Upcoming Events |
Straits Index (M)
Sdn Bhd
No. 16, Jalan LP 1A / 5, Lestari Perdana,
43300 Seri Kembangan, Selangor
Hotline: (03) 8941 6828 (5
lines) Fax: (03) 8941 9828
Email: info@straitsindex.com
© Copyright 1997-2007 Straits Index (M) Sdn Bhd All
rights reserved