Winchart Technical Analysis
Daily Market analysis

| Learn Technical Analysis and get your credit hours at the same time. WinChart Technical Analysis Training is Accredited by: | |||
 |
 |
||
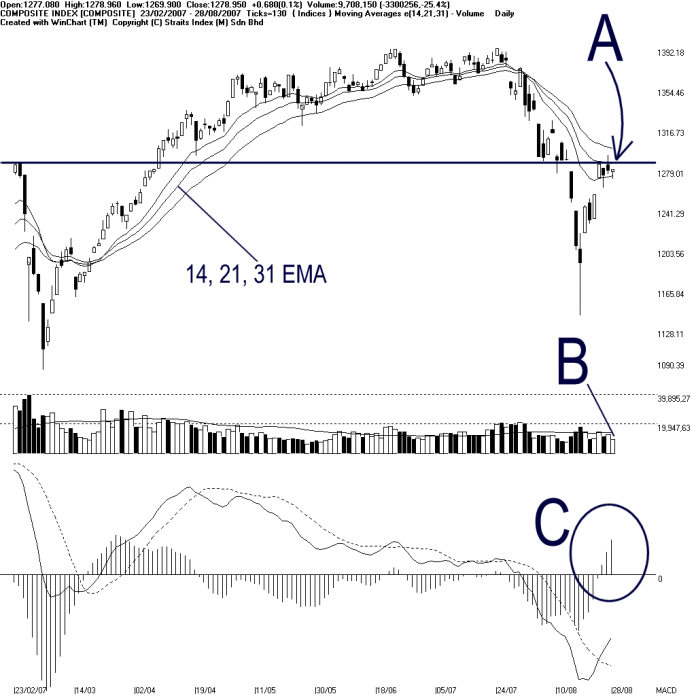
As indicated by A, the KLCI is still resisted by the 14, 21, 31 EMA. Therefore, if the KLCI should remain resisted by the 14, 21, 31 EMA, the outlook for the KLCI shall remains cautiously bearish biased. Nevertheless, the 1285 level, is still the resistance level to the KLCI.
Total market volume for Tuesday reduced 25.4% while remains below the 40-day VMA level. Therefore, this suggests that the market participation is still low, and inflow of fresh capital remains insufficient. In short, the sentiment for the market is still weak.
As circled at C, the MACD histogram remains rising, suggesting that the bullish MACD signal is still in control. If the MACD histogram should retreats and forms a rounding top, it would be a signal of a weakening bullish signal. Still, MACD is also a secondary indicator, and the priority of the analysis should be based on the chart patterns and primary indicators like moving average.
Find this analysis useful? Why not share it with others? Click Here to send this to a friend
 1st Online Training In Malaysia |
 |
 |
 |
| View the Online Training | More Market Analysis | Find out more about WinChart | Upcoming Events |
Straits Index (M)
Sdn Bhd
No. 16, Jalan LP 1A / 5, Lestari Perdana,
43300 Seri Kembangan, Selangor
Hotline: (03) 8941 6828 (5
lines) Fax: (03) 8941 9828
Email: info@straitsindex.com
© Copyright 1997-2007 Straits Index (M) Sdn Bhd All
rights reserved