Winchart Technical Analysis
Daily Market analysis

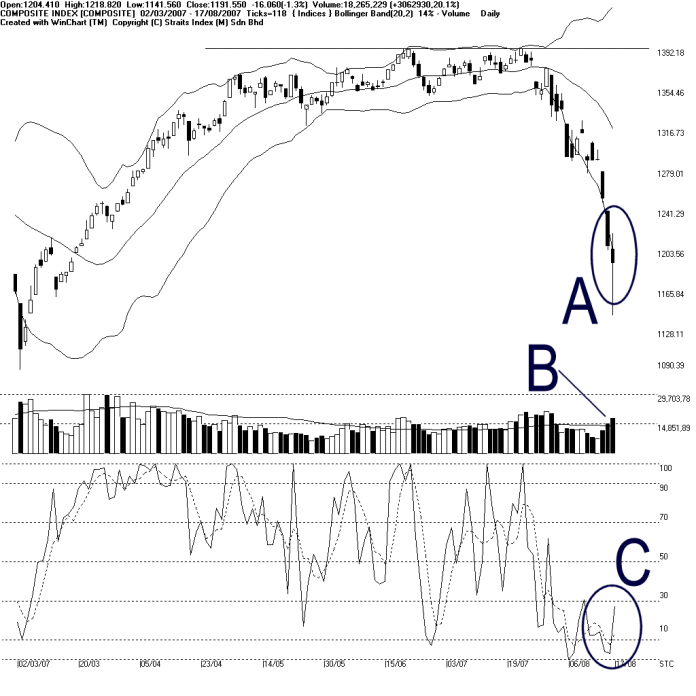
On Friday, the KLCI had a daily low reaching at 1141.56 points; and it rebounded and closed at 1191.55 points. As circled at A, the KLCI is still staying below the 20-day Bollinger Lower Band, and therefore, a pull-back effect is still likely to take place as a form of technical rebound.
Despite having a chance for a technical rebound, the immediate outlook for the KLCI remains bearish for it is still staying below the falling 14, 21, 31 EMA dynamic resistance.
Total market volume on Friday increased another 20.1%, suggesting an increase of conflict between the fearful sellers and the greedy buyers. Nevertheless, if the volume should maintain above the 40-day VMA level, with the KLCI rebounding, the market sentiment would improve.
As circled at C, the Stochastic rises above the 10% level, which is a short term technical rebound signal. However, with the Stochastic still staying below the 30% level, the market movement for the short term remains bearish biased. (Study C)
Find this analysis useful? Why not share it with others? Click Here to send this to a friend
 1st Online Training In Malaysia |
 |
 |
 |
| View the Online Training | More Market Analysis | Find out more about WinChart | Upcoming Events |
Straits Index (M)
Sdn Bhd
No. 16, Jalan LP 1A / 5, Lestari Perdana,
43300 Seri Kembangan, Selangor
Hotline: (03) 8941 6828 (5
lines) Fax: (03) 8941 9828
Email: info@straitsindex.com
© Copyright 1997-2007 Straits Index (M) Sdn Bhd All
rights reserved