Winchart Technical Analysis
Daily Market analysis

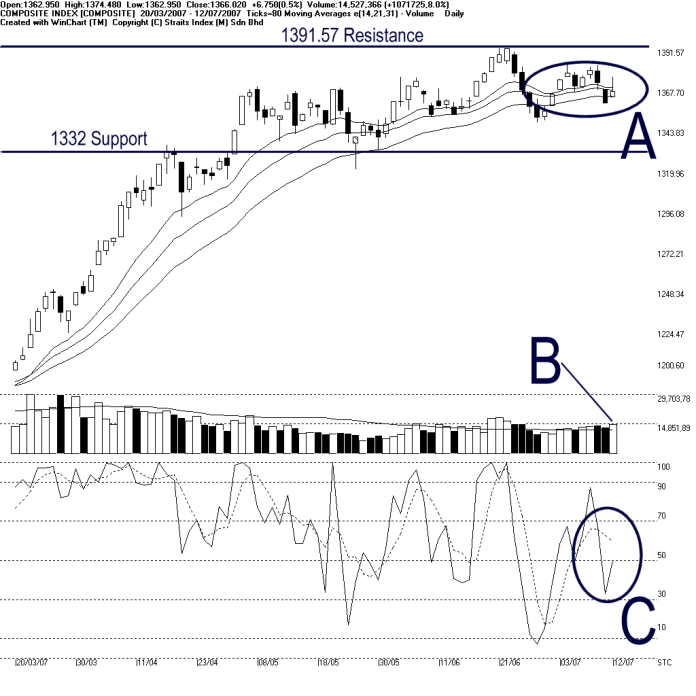
As circled by the A eclipse, the KLCI continued its sideways movement at the 14, 21, 31 EMA congestion area, and therefore, the direction for the KLCI remains unclear. Nevertheless, the 1391.57 resistance and the 1332 support remain intact.
Total market volume increased 8% on Thursday, with the volume staying above the 40-day VMA level. This suggests that the market is relatively well participated, and therefore, provided that the volume should continue staying above the 40-day VMA level, the sentiment for the market shall improve. If the KLCI should test the 1391.57 resistance, a higher volume is the important element. (Study B)
Nothing much changes for the short term movement for the Stochastic is basically still showing a neutral signal. As circled at C, the Stochastic remains in the neutral region around the 50% level. If the Stochastic should break above the 70% level, it would be a short term bullish signal. Otherwise, if the Stochastic should fall below the 30% level, it would be a short term bearish signal. (Study C)
Find this analysis useful? Why not share it with others? Click Here to send this to a friend
 1st Online Training In Malaysia |
 |
 |
 |
| View the Online Training | More Market Analysis | Find out more about WinChart | Upcoming Events |
Straits Index (M)
Sdn Bhd
No. 16, Jalan LP 1A / 5, Lestari Perdana,
43300 Seri Kembangan, Selangor
Hotline: (03) 8941 6828 (5
lines) Fax: (03) 8941 9828
Email: info@straitsindex.com
© Copyright 1997-2007 Straits Index (M) Sdn Bhd All
rights reserved