Winchart Technical Analysis
Daily Market analysis

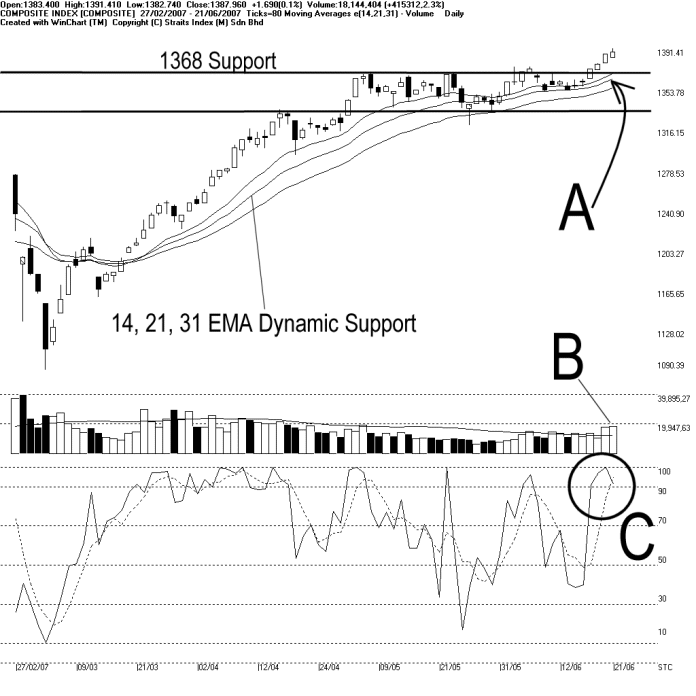
The KLCI touched another all time new high on Thursday at 1391.41 points. However, the volatility of the KLCI on Thursday has reduced, and closing only 1.69 points higher. Nevertheless, the 1368 level is the immediate support to the KLCI and the 14, 21, 31 EMA is still the dynamic support to the KLCI. (Study A)
Total market volume increased 2.3% on Thursday while remains above the 40-day VMA level. This suggests that the overall market participation is now relatively sufficient. Therefore, if the volume should stay above the 40-day VMA level, the bullish sentiment would sustain. (Study B)
As circled at C, the Stochastic %D is now above the 90% level, which is the short term over-bought region. This suggests that the KLCI is temporary slightly over-heated. Therefore, there is a risk for a technical correction for the KLCI. However, if the Stochastic should remains above the 70% level after a possible technical correction, the market movement for the short term remains bullish biased. (Study C)
Find this analysis useful? Why not share it with others? Click Here to send this to a friend
 1st Online Training In Malaysia |
 |
 |
 |
| View the Online Training | More Market Analysis | Find out more about WinChart | Upcoming Events |
Straits Index (M)
Sdn Bhd
No. 16, Jalan LP 1A / 5, Lestari Perdana,
43300 Seri Kembangan, Selangor
Hotline: (03) 8941 6828 (5
lines) Fax: (03) 8941 9828
Email: info@straitsindex.com
© Copyright 1997-2007 Straits Index (M) Sdn Bhd All
rights reserved