Winchart Technical Analysis
Daily Market analysis

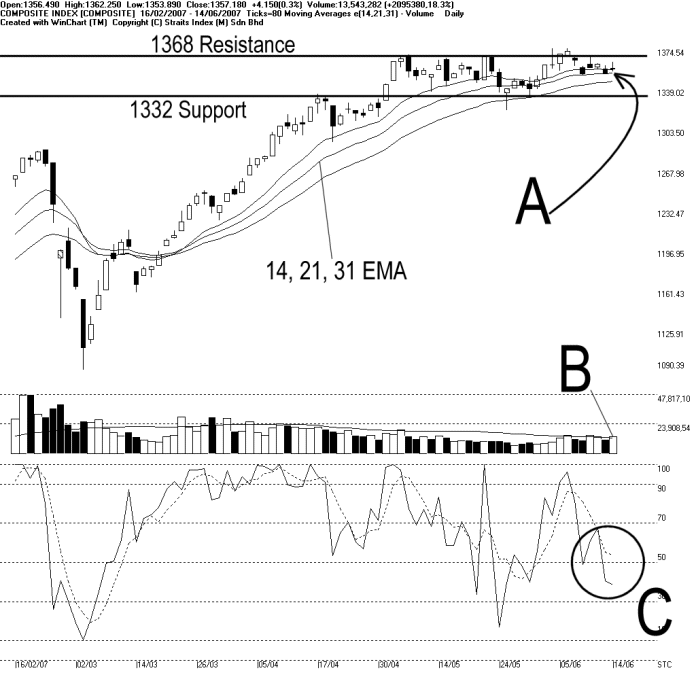
The KLCI endmixed on Thursday, closing 4.15 points higher to 1357.18 points. As shown on the chart above, the KLCI remains in its trading range of the 1368 resistance and the 1332 support. Therefore, the market direction is still unclear. Also, as indicated by A, the 14, 21, 31 EMA is still serving as the dynamic support to the KLCI.
Not much chain the market volume as the total market volume on Thursday only increased 18.3%. Volume on Thursday breaks above the 40-day VMA level by margin. If the volume should increase and remains above the 40-day VMA level, it would improve the market sentiment, and chances for the KLCI is breaking above the 1368 resistance would be higher. (Study B)
As circled at C, the Stochastic is still showing a short term neutral signal, suggesting a neutral market movement for the short term. Since Stochastic is a rather sensitive indicator, and therefore it is a good idea to monitor any changes of signal which could be treated as an early warning signal. If the Stochastic should break above the 70% level, it would be a short term bullish signal. Other wise, if the Stochastic should break below the 30% level, it would be a short term bearish signal. (Study C)
Find this analysis useful? Why not share it with others? Click Here to send this to a friend
 1st Online Training In Malaysia |
 |
 |
 |
| View the Online Training | More Market Analysis | Find out more about WinChart | Upcoming Events |
Straits Index (M)
Sdn Bhd
No. 16, Jalan LP 1A / 5, Lestari Perdana,
43300 Seri Kembangan, Selangor
Hotline: (03) 8941 6828 (5
lines) Fax: (03) 8941 9828
Email: info@straitsindex.com
© Copyright 1997-2007 Straits Index (M) Sdn Bhd All
rights reserved