Winchart Technical Analysis
Daily Market analysis

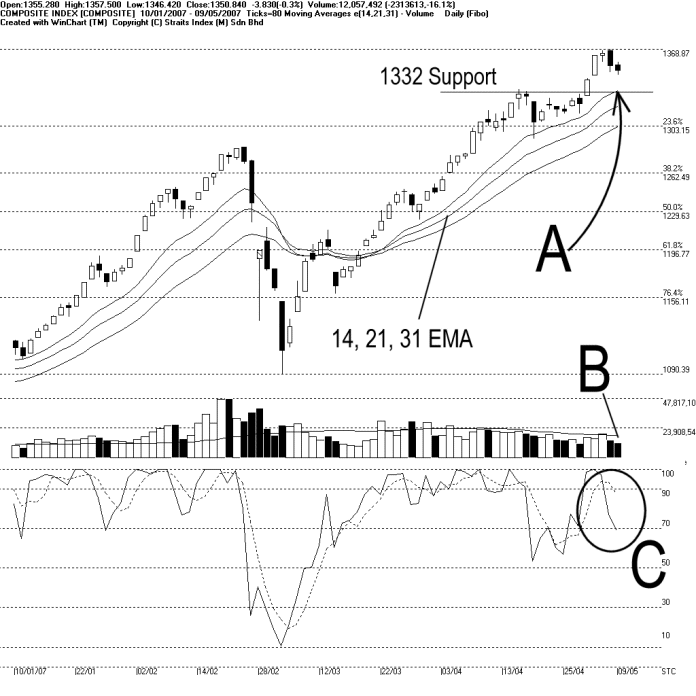
The KLCI continued its technical correction on Wednesday, closing 3.83 points lower to 1350.84 points. At the moment, the 1332 is still the support to the KLCI, while as indicated by A, the 14, 21, 31 EMA is still serving as the dynamic support to the KLCI.
Total market volume on Wednesday, declined another 16.1% while continuously staying below the 40-day VMA level. This suggested that the market participation is still low, thus the KLCI is likely to stay in its correction. If the KLCI should rebound from the dynamic support and resume its uptrend, the total market volume should increase and stay above the 40-day VMA level to confirm the upward movement. (Study B)
On Wednesday, the Stochastic %K line fell below the 70% by margin, while the %D line remained above the 70% level. If the Stochastic %D should fall below the 70% level, it would confirm the %K signal, and the short term movement for the KLCI would be at neutral. (Study C)
Find this analysis useful? Why not share it with others? Click Here to send this to a friend
 1st Online Training In Malaysia |
 |
 |
 |
| View the Online Training | More Market Analysis | Find out more about WinChart | Upcoming Events |
Straits Index (M)
Sdn Bhd
No. 16, Jalan LP 1A / 5, Lestari Perdana,
43300 Seri Kembangan, Selangor
Hotline: (03) 8941 6828 (5
lines) Fax: (03) 8941 9828
Email: info@straitsindex.com
© Copyright 1997-2007 Straits Index (M) Sdn Bhd All
rights reserved