Winchart Technical Analysis
Daily Market analysis

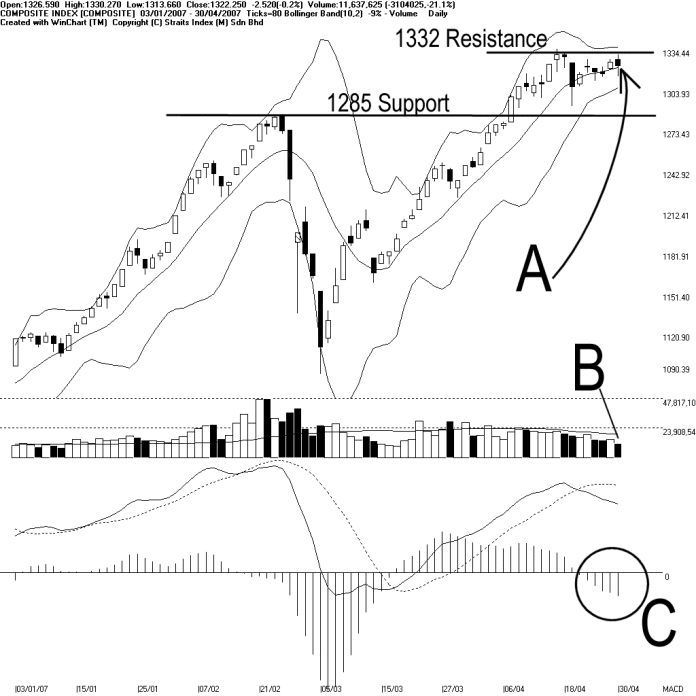
As shown on the chart above, the KLCI retested the 1332 resistance on Monday while remained resisted by the 1332 resistance. Meanwhile, as indicated by A, the Bollinger Band width remained in contraction. This suggests that the KLCI is still in its consolidation stage. However, it is worth while to monitor the Bollinger Band width for when the band width expands, it will suggest an end to the consolidation, and the market direction will be clearer.
As indicated by B, total market volume decreased 21.1%, and needless to mention, the volume was below the 40-day VMA level. This suggested that the overall market is lightly participated, and therefore, the KLCI is likely to stay sideways without sufficient inflow of fresh capital. (Study B)
As circled at C, the MACD histogram remained falling, suggested that the bearish signal was still in control. If the MACD histogram should rise and forms a rounding bottom, it would be a signal suggesting a weakening of the bearish signal. (Study C)
Find this analysis useful? Why not share it with others? Click Here to send this to a friend
 1st Online Training In Malaysia |
 |
 |
 |
| View the Online Training | More Market Analysis | Find out more about WinChart | Upcoming Events |
Straits Index (M)
Sdn Bhd
No. 16, Jalan LP 1A / 5, Lestari Perdana,
43300 Seri Kembangan, Selangor
Hotline: (03) 8941 6828 (5
lines) Fax: (03) 8941 9828
Email: info@straitsindex.com
© Copyright 1997-2007 Straits Index (M) Sdn Bhd All
rights reserved