Winchart Technical Analysis
Daily Market analysis

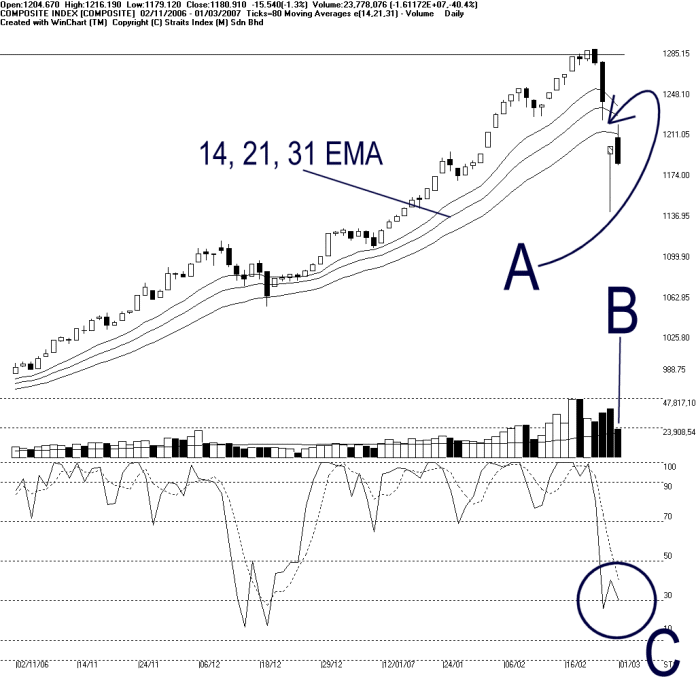
KLCI rebounded in the early trading session, almost closing the gap. However, as pointed by A, the KLCI is now resisted by the 14, 21, 31 EMA, and therefore, if the KLCI continued staying below the falling 14, 21, 31 EMA dynamic resistance, the KLCI is likely to stay bearish. (Study A)
Total market volume declined another 40.4% on Thursday, suggested a reduced market participation. If the KLCI was to stay sideways, a lower volume during the sideways movement would be considered healthy. However, if the low volume persist with the KLCI remained below the dynamic resistance, the KLCI is likely to stay weak. (Study B)
Stochastic %K tested the 30% level again on Thursday, with the %D line falling lower. If Stochastic fell below 30% level, the market movement for the short-term would be bearish bias. (Study C)
Find this analysis useful? Why not share it with others? Click Here to send this to a friend
 1st Online Training In Malaysia |
 |
 |
 |
| View the Online Training | More Market Analysis | Find out more about WinChart | Upcoming Events |
Straits Index (M)
Sdn Bhd
No. 16, Jalan LP 1A / 5, Lestari Perdana,
43300 Seri Kembangan, Selangor
Hotline: (03) 8941 6828 (5
lines) Fax: (03) 8941 9828
Email: info@straitsindex.com
© Copyright 1997-2007 Straits Index (M) Sdn Bhd All
rights reserved