Winchart Technical Analysis
Daily Market analysis

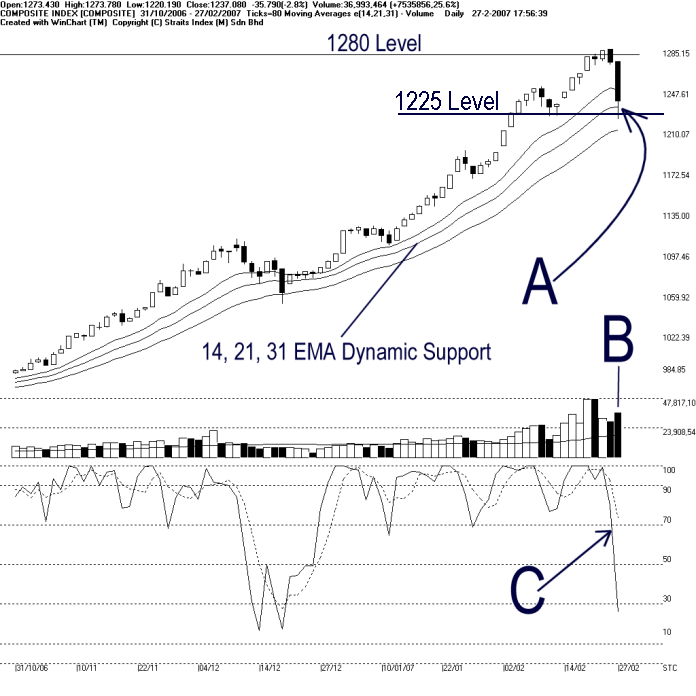
KLCI has a drastic correction on Tuesday, ended the day 35.79 points lower to 1237.08 points. As shown on the chart above, 1280 remained as the resistance level while the 1225 is the immediate support to the KLCI. Mean while, as pointed by A, the 14, 21, 31 EMA is still the dynamic support to the KLCI, and therefore, the KLCI has not turned into a bear trend yet.
As pointed by B, total market volume increased 25.6%, with nearly 3.7 billion shares traded. As we had mentioned earlier, whenever the market volume hit new high, it implied a higher risk of a technical correction. Therefore, the KLCI is still under a correction stage. (Study B)
As pointed by C, Stochastic %K fell below 70% level, ended the short-term bullish signal. If the %D line fell below 70% level, it shall confirm the %K signal. Mean while, %K line also broke below 30% level marginally. If the %D line fell below 30% level, it shall be a short-term bearish signal.
Find this analysis useful? Why not share it with others? Click Here to send this to a friend
 1st Online Training In Malaysia |
 |
 |
 |
| View the Online Training | More Market Analysis | Find out more about WinChart | Upcoming Events |
Straits Index (M)
Sdn Bhd
No. 16, Jalan LP 1A / 5, Lestari Perdana,
43300 Seri Kembangan, Selangor
Hotline: (03) 8941 6828 (5
lines) Fax: (03) 8941 9828
Email: info@straitsindex.com
© Copyright 1997-2007 Straits Index (M) Sdn Bhd All
rights reserved