Winchart Technical Analysis
Daily Market analysis

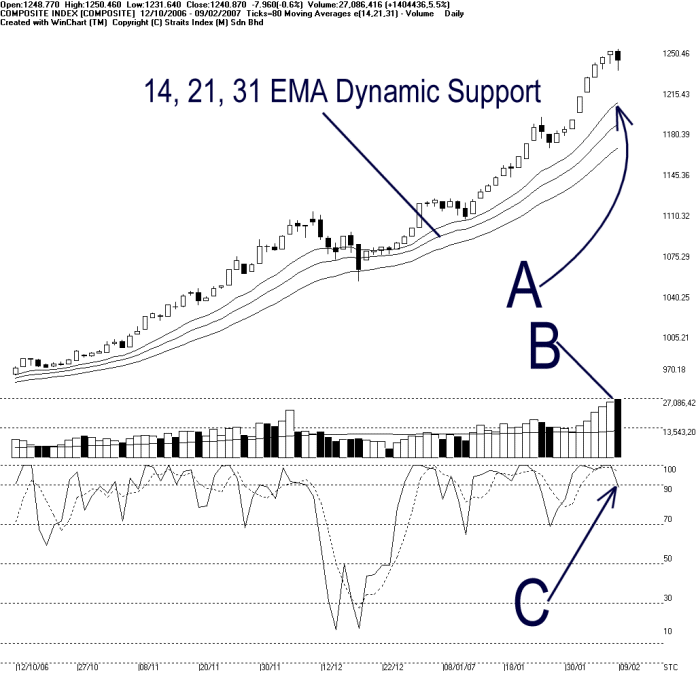
After a rising for 8 trading days consecutively, the KLCI had its first technical correct on Friday, ended the day 7.96 points lower to 1240.87 points. Therefore, the immediate resistance for the KLCI is at 1250.46 points while the 14, 21, 31 EMA is still serving as the dynamic support to the KLCI.
Total market volume on Friday added another 5.5% with over 2.7 billion shares traded. Technically speaking, this is not a healthy signal for a healthy correction should usually come with a lower volume. Nevertheless, as mentioned on our previous analysis, when market volume is making new high, it is usually a signal suggesting that the market is over-heated. (Study B)
As pointed by C, Stochastic %K started dropping while fell below the 90% level by margin. This signal a beginning of a short-term technical correction. Anyway, if the Stochastic could stay above 70% level, the market movement for the short-term is still bullish bias. (Study C)
Find this analysis useful? Why not share it with others? Click Here to send this to a friend
 1st Online Training In Malaysia |
 |
 |
 |
| View the Online Training | More Market Analysis | Find out more about WinChart | Upcoming Events |
Straits Index (M)
Sdn Bhd
No. 16, Jalan LP 1A / 5, Lestari Perdana,
43300 Seri Kembangan, Selangor
Hotline: (03) 8941 6828 (5
lines) Fax: (03) 8941 9828
Email: info@straitsindex.com
© Copyright 1997-2007 Straits Index (M) Sdn Bhd All
rights reserved