Winchart Technical Analysis
Daily Market analysis

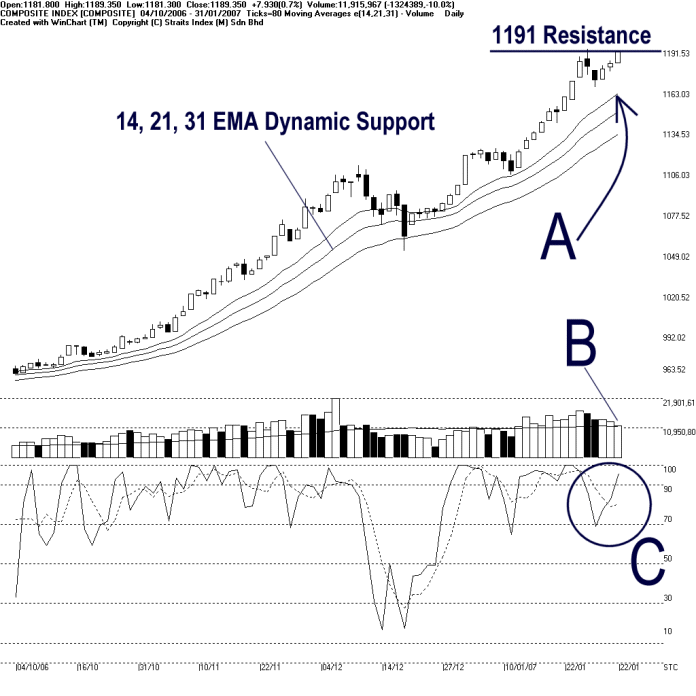
KLCI retested the 1191 resistance on Wednesday, ended the day at its daily high at 1189.35 points, up 7.93 points. As shown on the chart above, 1191 remained as the immediate resistance to the KLCI. While the rising 14, 21, 31 EMA, (as pointed by A) is still serving as the dynamic support to the KLCI. Therefore, with the KLCI being supported by the rising dynamic support, the outlook for the KLCI shall remained bullish bias.
Despite the KLCI ended higher, total market volume declined 10% to only 119 million shares. In addition to that, the total market volume for Wednesday was barely above the 40 days VMA level, and therefore, it is relatively insufficient to support the attempt in breaking the 1191 resistance level. Nonetheless, if the KLCI was to break above the immediate resistance, a significant increase of volume is needed to support the breakout, or else, the break out would not likely be valid. (Study B)
As clearly shown by the C circle, Stochastic continued staying above 70% level in the short-term bullish region. Therefore, based on the Stochastic reading, the market movement for the short-term is still at bullish. (Study C)
Find this analysis useful? Why not share it with others? Click Here to send this to a friend
 1st Online Training In Malaysia |
 |
 |
 |
| View the Online Training | More Market Analysis | Find out more about WinChart | Upcoming Events |
Straits Index (M)
Sdn Bhd
No. 16, Jalan LP 1A / 5, Lestari Perdana,
43300 Seri Kembangan, Selangor
Hotline: (03) 8941 6828 (5
lines) Fax: (03) 8941 9828
Email: info@straitsindex.com
© Copyright 1997-2007 Straits Index (M) Sdn Bhd All
rights reserved