Winchart Technical Analysis
Daily Market analysis

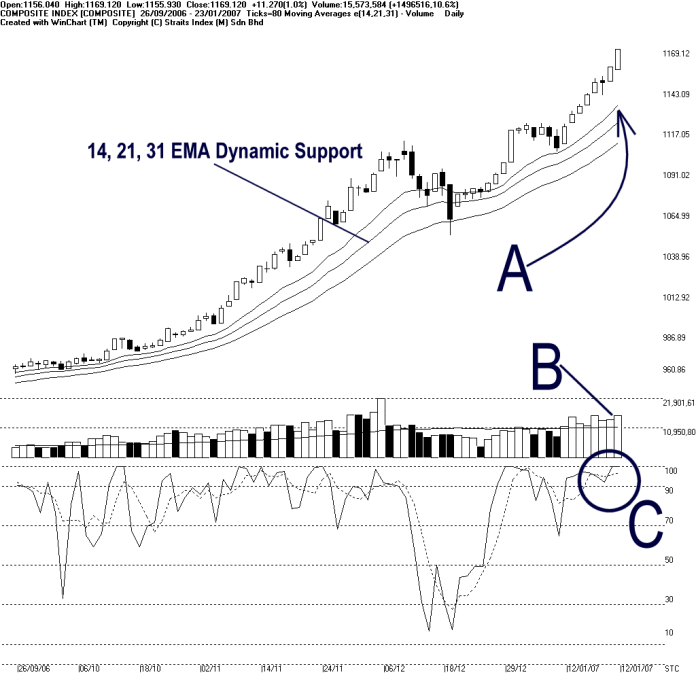
Despite the over-night losses of US market, the KLCI made another multi-year new high at 1169.12 on Tuesday, up 11.27 points. As pointed by A, the rising 14, 21, 31 EMA shall continue serving as the dynamic support to the KLCI, and provided that the KLCI could remained supported by the rising dynamic support, the KLCI is likely to test the next resistance, which is the 1200 level. (Study A)
Total market volume for Tuesday increased another 10.6%, with over 1.5 billion shares traded. Volume stayed firmly above the 40 days VMA level, suggested that the overall market was well participated. Provided that the volume could stay above 40 days VMA, the bullish sentiment is likely to sustain. (Study B)
As circled by C, Stochastic remained above 90% level, which is the over-bought region. This suggested that the short-term movement for the KLCI is over-heated, therefore, the correction for the KLCI is still over-due. However, provided that the Stochastic could stay above 70% level, the short-term movement for the KLCI is likely to be bullish. (Study C)
Find this analysis useful? Why not share it with others? Click Here to send this to a friend
 1st Online Training In Malaysia |
 |
 |
 |
| View the Online Training | More Market Analysis | Find out more about WinChart | Upcoming Events |
Straits Index (M)
Sdn Bhd
No. 16, Jalan LP 1A / 5, Lestari Perdana,
43300 Seri Kembangan, Selangor
Hotline: (03) 8941 6828 (5
lines) Fax: (03) 8941 9828
Email: info@straitsindex.com
© Copyright 1997-2007 Straits Index (M) Sdn Bhd All
rights reserved